Immigrants from Mexico vs Slovene Unemployment Among Ages 20 to 24 years
COMPARE
Immigrants from Mexico
Slovene
Unemployment Among Ages 20 to 24 years
Unemployment Among Ages 20 to 24 years Comparison
Immigrants from Mexico
Slovenes
10.7%
UNEMPLOYMENT AMONG AGES 20 TO 24 YEARS
1.2/ 100
METRIC RATING
244th/ 347
METRIC RANK
9.3%
UNEMPLOYMENT AMONG AGES 20 TO 24 YEARS
100.0/ 100
METRIC RATING
14th/ 347
METRIC RANK
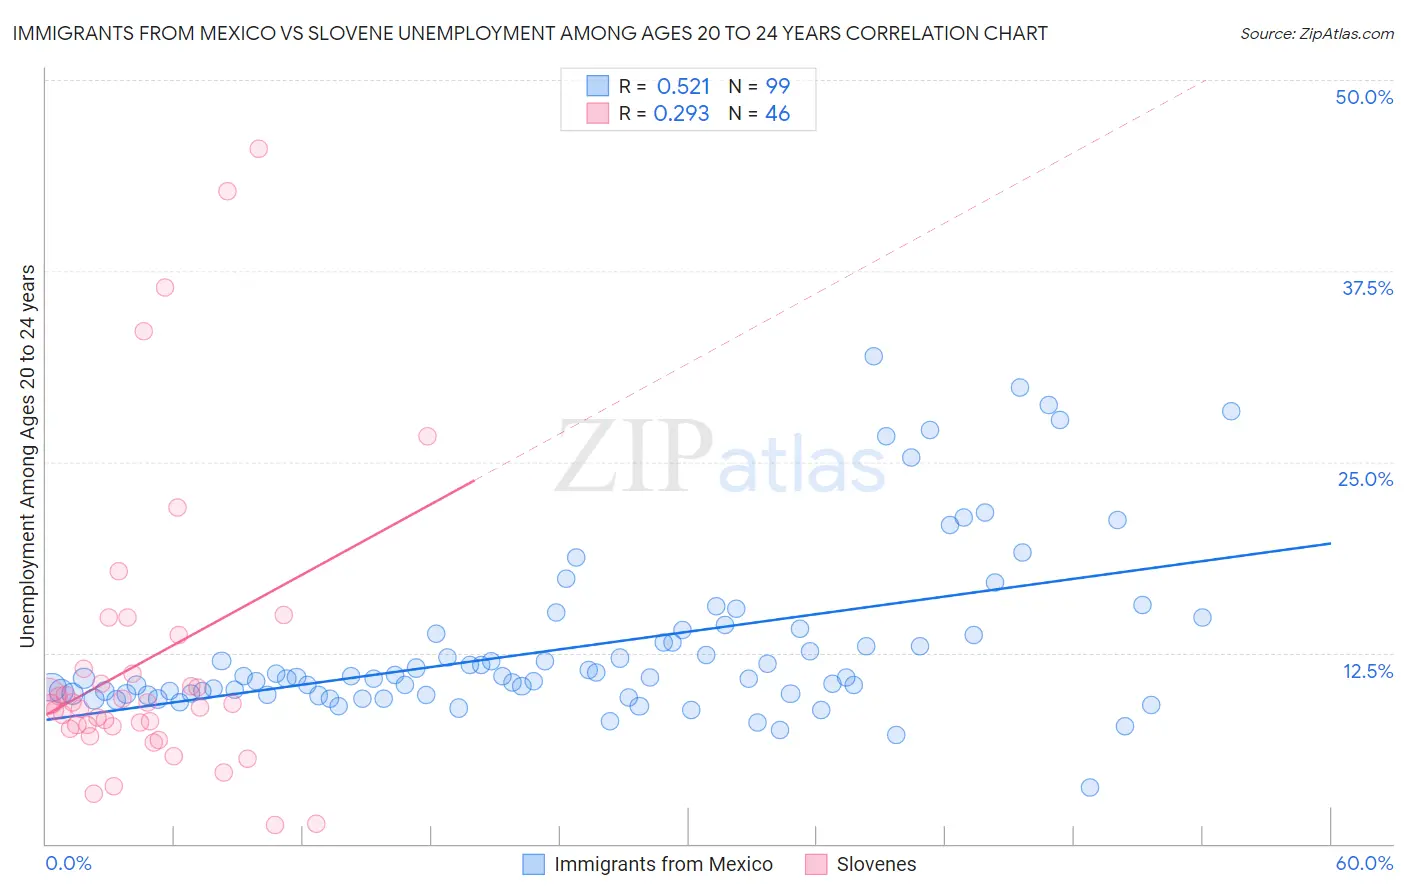
Immigrants from Mexico vs Slovene Unemployment Among Ages 20 to 24 years Correlation Chart
The statistical analysis conducted on geographies consisting of 484,195,131 people shows a substantial positive correlation between the proportion of Immigrants from Mexico and unemployment rate among population between the ages 20 and 24 in the United States with a correlation coefficient (R) of 0.521 and weighted average of 10.7%. Similarly, the statistical analysis conducted on geographies consisting of 254,150,384 people shows a weak positive correlation between the proportion of Slovenes and unemployment rate among population between the ages 20 and 24 in the United States with a correlation coefficient (R) of 0.293 and weighted average of 9.3%, a difference of 15.7%.
Unemployment Among Ages 20 to 24 years Correlation Summary
| Measurement | Immigrants from Mexico | Slovene |
| Minimum | 3.7% | 1.2% |
| Maximum | 31.9% | 45.5% |
| Range | 28.2% | 44.3% |
| Mean | 12.9% | 12.1% |
| Median | 10.9% | 9.2% |
| Interquartile 25% (IQ1) | 9.8% | 7.7% |
| Interquartile 75% (IQ3) | 13.8% | 11.5% |
| Interquartile Range (IQR) | 4.0% | 3.8% |
| Standard Deviation (Sample) | 5.5% | 9.8% |
| Standard Deviation (Population) | 5.5% | 9.7% |
Similar Demographics by Unemployment Among Ages 20 to 24 years
Demographics Similar to Immigrants from Mexico by Unemployment Among Ages 20 to 24 years
In terms of unemployment among ages 20 to 24 years, the demographic groups most similar to Immigrants from Mexico are Immigrants from Belarus (10.7%, a difference of 0.060%), Moroccan (10.7%, a difference of 0.10%), Hispanic or Latino (10.7%, a difference of 0.19%), Immigrants from El Salvador (10.7%, a difference of 0.27%), and Immigrants from Iran (10.8%, a difference of 0.33%).
| Demographics | Rating | Rank | Unemployment Among Ages 20 to 24 years |
| Immigrants | Immigrants | 2.7 /100 | #237 | Tragic 10.6% |
| Immigrants | Pakistan | 2.6 /100 | #238 | Tragic 10.6% |
| Salvadorans | 2.4 /100 | #239 | Tragic 10.7% |
| Immigrants | Central America | 2.0 /100 | #240 | Tragic 10.7% |
| Immigrants | El Salvador | 1.7 /100 | #241 | Tragic 10.7% |
| Moroccans | 1.4 /100 | #242 | Tragic 10.7% |
| Immigrants | Belarus | 1.3 /100 | #243 | Tragic 10.7% |
| Immigrants | Mexico | 1.2 /100 | #244 | Tragic 10.7% |
| Hispanics or Latinos | 1.0 /100 | #245 | Tragic 10.7% |
| Immigrants | Iran | 0.9 /100 | #246 | Tragic 10.8% |
| Immigrants | Albania | 0.7 /100 | #247 | Tragic 10.8% |
| Cree | 0.6 /100 | #248 | Tragic 10.8% |
| South American Indians | 0.5 /100 | #249 | Tragic 10.8% |
| Albanians | 0.5 /100 | #250 | Tragic 10.8% |
| Immigrants | Panama | 0.4 /100 | #251 | Tragic 10.8% |
Demographics Similar to Slovenes by Unemployment Among Ages 20 to 24 years
In terms of unemployment among ages 20 to 24 years, the demographic groups most similar to Slovenes are Immigrants from Sudan (9.3%, a difference of 0.030%), Danish (9.3%, a difference of 0.19%), Immigrants from Congo (9.2%, a difference of 0.38%), Cuban (9.2%, a difference of 0.47%), and Zimbabwean (9.2%, a difference of 0.57%).
| Demographics | Rating | Rank | Unemployment Among Ages 20 to 24 years |
| Luxembourgers | 100.0 /100 | #7 | Exceptional 9.1% |
| Somalis | 100.0 /100 | #8 | Exceptional 9.1% |
| Immigrants | Somalia | 100.0 /100 | #9 | Exceptional 9.2% |
| Sudanese | 100.0 /100 | #10 | Exceptional 9.2% |
| Zimbabweans | 100.0 /100 | #11 | Exceptional 9.2% |
| Cubans | 100.0 /100 | #12 | Exceptional 9.2% |
| Immigrants | Congo | 100.0 /100 | #13 | Exceptional 9.2% |
| Slovenes | 100.0 /100 | #14 | Exceptional 9.3% |
| Immigrants | Sudan | 100.0 /100 | #15 | Exceptional 9.3% |
| Danes | 100.0 /100 | #16 | Exceptional 9.3% |
| Czechs | 100.0 /100 | #17 | Exceptional 9.3% |
| Chinese | 100.0 /100 | #18 | Exceptional 9.4% |
| Hmong | 100.0 /100 | #19 | Exceptional 9.4% |
| Osage | 100.0 /100 | #20 | Exceptional 9.4% |
| Immigrants | Bosnia and Herzegovina | 100.0 /100 | #21 | Exceptional 9.4% |