Immigrants from Mexico vs Hawaiian Male Unemployment
COMPARE
Immigrants from Mexico
Hawaiian
Male Unemployment
Male Unemployment Comparison
Immigrants from Mexico
Hawaiians
5.9%
MALE UNEMPLOYMENT
0.0/ 100
METRIC RATING
264th/ 347
METRIC RANK
5.7%
MALE UNEMPLOYMENT
0.6/ 100
METRIC RATING
247th/ 347
METRIC RANK
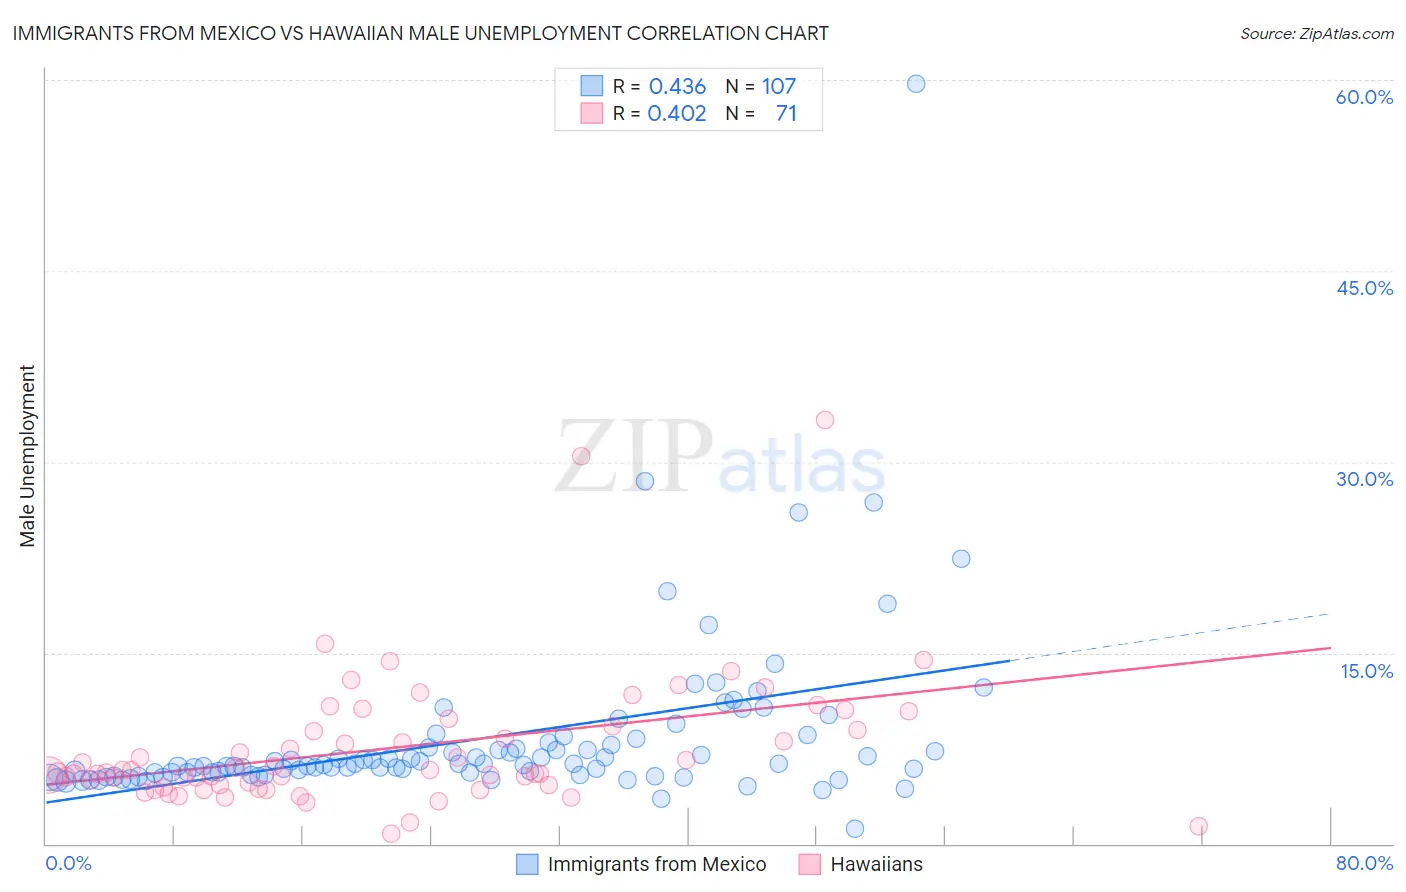
Immigrants from Mexico vs Hawaiian Male Unemployment Correlation Chart
The statistical analysis conducted on geographies consisting of 508,075,361 people shows a moderate positive correlation between the proportion of Immigrants from Mexico and unemployment rate among males in the United States with a correlation coefficient (R) of 0.436 and weighted average of 5.9%. Similarly, the statistical analysis conducted on geographies consisting of 326,392,537 people shows a moderate positive correlation between the proportion of Hawaiians and unemployment rate among males in the United States with a correlation coefficient (R) of 0.402 and weighted average of 5.7%, a difference of 3.4%.
Male Unemployment Correlation Summary
| Measurement | Immigrants from Mexico | Hawaiian |
| Minimum | 1.2% | 0.80% |
| Maximum | 59.7% | 33.3% |
| Range | 58.5% | 32.5% |
| Mean | 8.3% | 7.5% |
| Median | 6.2% | 5.6% |
| Interquartile 25% (IQ1) | 5.4% | 4.6% |
| Interquartile 75% (IQ3) | 7.8% | 9.2% |
| Interquartile Range (IQR) | 2.4% | 4.6% |
| Standard Deviation (Sample) | 6.8% | 5.3% |
| Standard Deviation (Population) | 6.8% | 5.3% |
Demographics Similar to Immigrants from Mexico and Hawaiians by Male Unemployment
In terms of male unemployment, the demographic groups most similar to Immigrants from Mexico are Immigrants from Latin America (5.9%, a difference of 0.22%), French American Indian (5.9%, a difference of 0.39%), Immigrants from Portugal (5.9%, a difference of 0.46%), Liberian (5.8%, a difference of 0.92%), and Immigrants from Central America (5.8%, a difference of 1.1%). Similarly, the demographic groups most similar to Hawaiians are Iroquois (5.7%, a difference of 0.10%), Yaqui (5.7%, a difference of 0.19%), Marshallese (5.7%, a difference of 0.32%), Cree (5.7%, a difference of 0.39%), and Immigrants from Bahamas (5.7%, a difference of 0.63%).
| Demographics | Rating | Rank | Male Unemployment |
| Yaqui | 0.7 /100 | #245 | Tragic 5.7% |
| Iroquois | 0.6 /100 | #246 | Tragic 5.7% |
| Hawaiians | 0.6 /100 | #247 | Tragic 5.7% |
| Marshallese | 0.5 /100 | #248 | Tragic 5.7% |
| Cree | 0.4 /100 | #249 | Tragic 5.7% |
| Immigrants | Bahamas | 0.4 /100 | #250 | Tragic 5.7% |
| Spanish Americans | 0.3 /100 | #251 | Tragic 5.7% |
| Mexicans | 0.2 /100 | #252 | Tragic 5.8% |
| Mexican American Indians | 0.2 /100 | #253 | Tragic 5.8% |
| Japanese | 0.2 /100 | #254 | Tragic 5.8% |
| Kiowa | 0.2 /100 | #255 | Tragic 5.8% |
| Comanche | 0.2 /100 | #256 | Tragic 5.8% |
| Hispanics or Latinos | 0.1 /100 | #257 | Tragic 5.8% |
| Dutch West Indians | 0.1 /100 | #258 | Tragic 5.8% |
| Cajuns | 0.1 /100 | #259 | Tragic 5.8% |
| Immigrants | Central America | 0.1 /100 | #260 | Tragic 5.8% |
| Liberians | 0.1 /100 | #261 | Tragic 5.8% |
| Immigrants | Portugal | 0.1 /100 | #262 | Tragic 5.9% |
| Immigrants | Latin America | 0.1 /100 | #263 | Tragic 5.9% |
| Immigrants | Mexico | 0.0 /100 | #264 | Tragic 5.9% |
| French American Indians | 0.0 /100 | #265 | Tragic 5.9% |