Immigrants from Mexico vs British Unemployment Among Seniors over 75 years
COMPARE
Immigrants from Mexico
British
Unemployment Among Seniors over 75 years
Unemployment Among Seniors over 75 years Comparison
Immigrants from Mexico
British
9.4%
UNEMPLOYMENT AMONG SENIORS OVER 75 YEARS
0.4/ 100
METRIC RATING
267th/ 347
METRIC RANK
9.6%
UNEMPLOYMENT AMONG SENIORS OVER 75 YEARS
0.1/ 100
METRIC RATING
279th/ 347
METRIC RANK
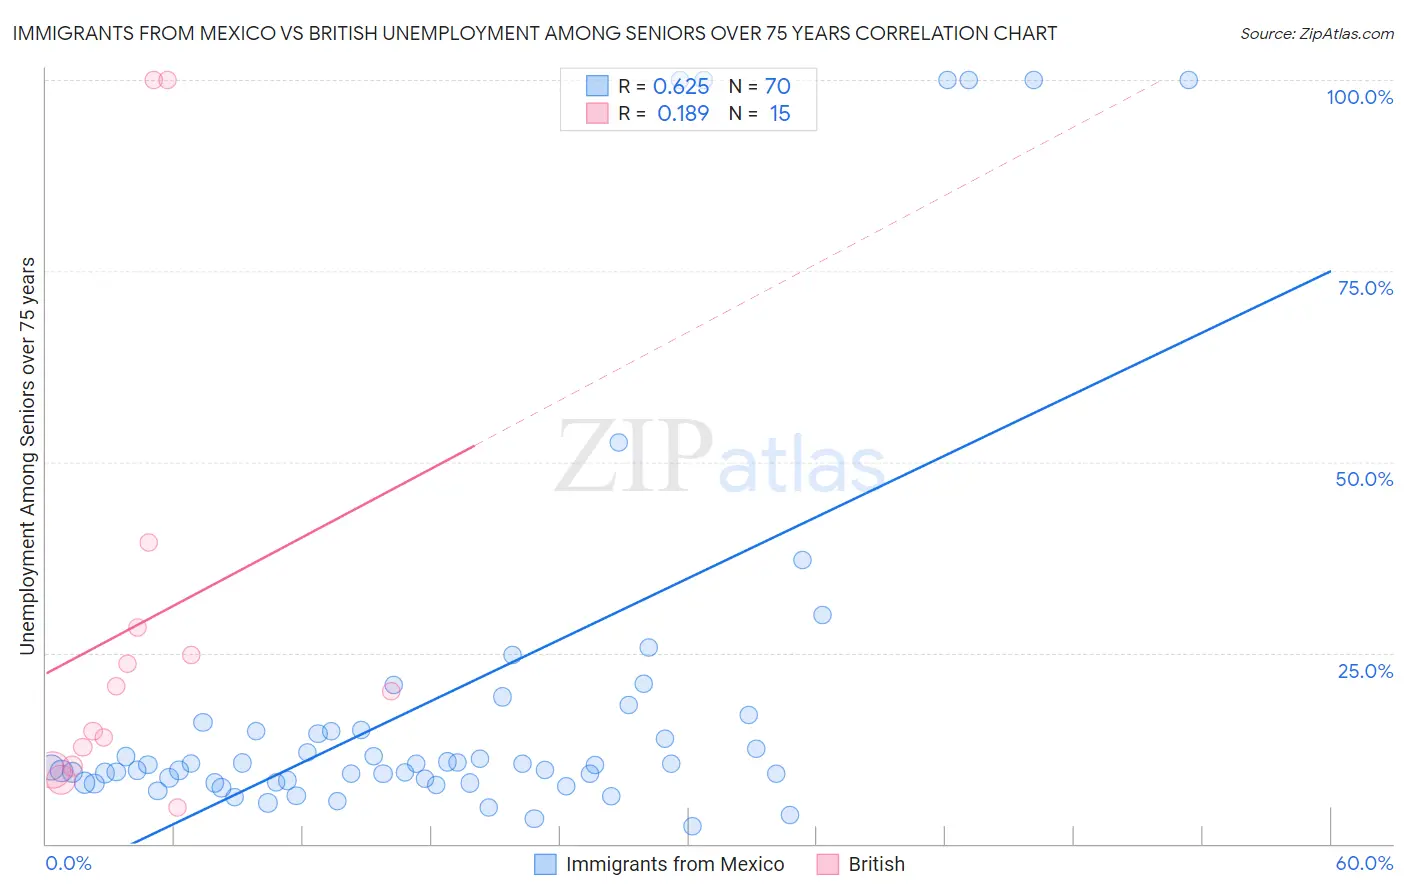
Immigrants from Mexico vs British Unemployment Among Seniors over 75 years Correlation Chart
The statistical analysis conducted on geographies consisting of 225,940,289 people shows a significant positive correlation between the proportion of Immigrants from Mexico and unemployment rate among seniors over the age of 75 in the United States with a correlation coefficient (R) of 0.625 and weighted average of 9.4%. Similarly, the statistical analysis conducted on geographies consisting of 229,722,918 people shows a poor positive correlation between the proportion of British and unemployment rate among seniors over the age of 75 in the United States with a correlation coefficient (R) of 0.189 and weighted average of 9.6%, a difference of 2.1%.
Unemployment Among Seniors over 75 years Correlation Summary
| Measurement | Immigrants from Mexico | British |
| Minimum | 2.3% | 4.7% |
| Maximum | 100.0% | 100.0% |
| Range | 97.7% | 95.3% |
| Mean | 19.5% | 28.7% |
| Median | 10.3% | 20.0% |
| Interquartile 25% (IQ1) | 8.1% | 10.2% |
| Interquartile 75% (IQ3) | 14.9% | 28.2% |
| Interquartile Range (IQR) | 6.8% | 18.1% |
| Standard Deviation (Sample) | 26.0% | 30.3% |
| Standard Deviation (Population) | 25.8% | 29.2% |
Demographics Similar to Immigrants from Mexico and British by Unemployment Among Seniors over 75 years
In terms of unemployment among seniors over 75 years, the demographic groups most similar to Immigrants from Mexico are Black/African American (9.4%, a difference of 0.12%), Greek (9.4%, a difference of 0.16%), Puerto Rican (9.4%, a difference of 0.30%), Yaqui (9.4%, a difference of 0.40%), and Palestinian (9.3%, a difference of 0.44%). Similarly, the demographic groups most similar to British are Croatian (9.6%, a difference of 0.14%), Immigrants from Senegal (9.6%, a difference of 0.15%), Bangladeshi (9.6%, a difference of 0.30%), Swiss (9.5%, a difference of 0.48%), and Macedonian (9.6%, a difference of 0.64%).
| Demographics | Rating | Rank | Unemployment Among Seniors over 75 years |
| Ukrainians | 0.7 /100 | #263 | Tragic 9.3% |
| Iroquois | 0.7 /100 | #264 | Tragic 9.3% |
| Palestinians | 0.6 /100 | #265 | Tragic 9.3% |
| Blacks/African Americans | 0.5 /100 | #266 | Tragic 9.4% |
| Immigrants | Mexico | 0.4 /100 | #267 | Tragic 9.4% |
| Greeks | 0.4 /100 | #268 | Tragic 9.4% |
| Puerto Ricans | 0.3 /100 | #269 | Tragic 9.4% |
| Yaqui | 0.3 /100 | #270 | Tragic 9.4% |
| Bulgarians | 0.3 /100 | #271 | Tragic 9.4% |
| Immigrants | Iraq | 0.3 /100 | #272 | Tragic 9.4% |
| Czechoslovakians | 0.3 /100 | #273 | Tragic 9.4% |
| Jamaicans | 0.2 /100 | #274 | Tragic 9.5% |
| Senegalese | 0.2 /100 | #275 | Tragic 9.5% |
| Arabs | 0.2 /100 | #276 | Tragic 9.5% |
| Swiss | 0.1 /100 | #277 | Tragic 9.5% |
| Immigrants | Senegal | 0.1 /100 | #278 | Tragic 9.6% |
| British | 0.1 /100 | #279 | Tragic 9.6% |
| Croatians | 0.1 /100 | #280 | Tragic 9.6% |
| Bangladeshis | 0.1 /100 | #281 | Tragic 9.6% |
| Macedonians | 0.0 /100 | #282 | Tragic 9.6% |
| Immigrants | Nigeria | 0.0 /100 | #283 | Tragic 9.6% |