Immigrants from Lithuania vs Immigrants from Ukraine Unemployment Among Ages 35 to 44 years
COMPARE
Immigrants from Lithuania
Immigrants from Ukraine
Unemployment Among Ages 35 to 44 years
Unemployment Among Ages 35 to 44 years Comparison
Immigrants from Lithuania
Immigrants from Ukraine
4.4%
UNEMPLOYMENT AMONG AGES 35 TO 44 YEARS
96.7/ 100
METRIC RATING
71st/ 347
METRIC RANK
4.8%
UNEMPLOYMENT AMONG AGES 35 TO 44 YEARS
21.4/ 100
METRIC RATING
200th/ 347
METRIC RANK
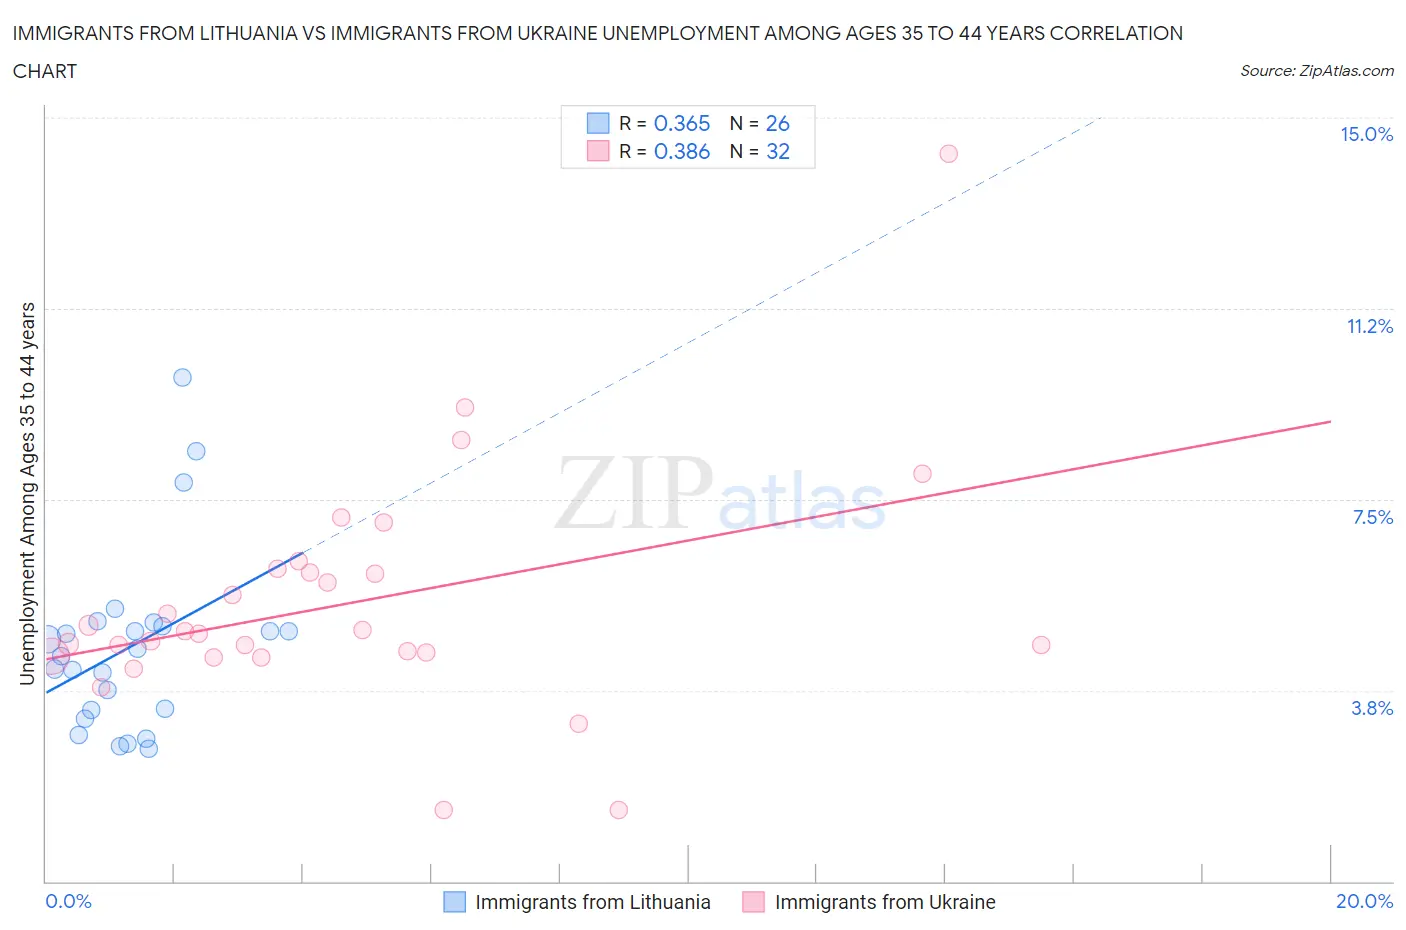
Immigrants from Lithuania vs Immigrants from Ukraine Unemployment Among Ages 35 to 44 years Correlation Chart
The statistical analysis conducted on geographies consisting of 116,771,624 people shows a mild positive correlation between the proportion of Immigrants from Lithuania and unemployment rate among population between the ages 35 and 44 in the United States with a correlation coefficient (R) of 0.365 and weighted average of 4.4%. Similarly, the statistical analysis conducted on geographies consisting of 285,095,917 people shows a mild positive correlation between the proportion of Immigrants from Ukraine and unemployment rate among population between the ages 35 and 44 in the United States with a correlation coefficient (R) of 0.386 and weighted average of 4.8%, a difference of 8.8%.
Unemployment Among Ages 35 to 44 years Correlation Summary
| Measurement | Immigrants from Lithuania | Immigrants from Ukraine |
| Minimum | 2.6% | 1.4% |
| Maximum | 9.9% | 14.3% |
| Range | 7.3% | 12.9% |
| Mean | 4.6% | 5.5% |
| Median | 4.5% | 4.9% |
| Interquartile 25% (IQ1) | 3.4% | 4.5% |
| Interquartile 75% (IQ3) | 5.0% | 6.1% |
| Interquartile Range (IQR) | 1.6% | 1.7% |
| Standard Deviation (Sample) | 1.8% | 2.3% |
| Standard Deviation (Population) | 1.7% | 2.3% |
Similar Demographics by Unemployment Among Ages 35 to 44 years
Demographics Similar to Immigrants from Lithuania by Unemployment Among Ages 35 to 44 years
In terms of unemployment among ages 35 to 44 years, the demographic groups most similar to Immigrants from Lithuania are Slovene (4.4%, a difference of 0.0%), Immigrants from China (4.4%, a difference of 0.0%), Argentinean (4.4%, a difference of 0.070%), Immigrants from Ireland (4.4%, a difference of 0.070%), and Icelander (4.4%, a difference of 0.080%).
| Demographics | Rating | Rank | Unemployment Among Ages 35 to 44 years |
| Immigrants | Serbia | 97.0 /100 | #64 | Exceptional 4.4% |
| Cambodians | 97.0 /100 | #65 | Exceptional 4.4% |
| Icelanders | 96.8 /100 | #66 | Exceptional 4.4% |
| Argentineans | 96.8 /100 | #67 | Exceptional 4.4% |
| Immigrants | Ireland | 96.8 /100 | #68 | Exceptional 4.4% |
| Slovenes | 96.7 /100 | #69 | Exceptional 4.4% |
| Immigrants | China | 96.7 /100 | #70 | Exceptional 4.4% |
| Immigrants | Lithuania | 96.7 /100 | #71 | Exceptional 4.4% |
| Northern Europeans | 96.5 /100 | #72 | Exceptional 4.4% |
| Lithuanians | 96.5 /100 | #73 | Exceptional 4.4% |
| Poles | 96.4 /100 | #74 | Exceptional 4.4% |
| Immigrants | Romania | 96.3 /100 | #75 | Exceptional 4.4% |
| Immigrants | Jordan | 96.3 /100 | #76 | Exceptional 4.4% |
| Dutch | 96.1 /100 | #77 | Exceptional 4.4% |
| Indians (Asian) | 96.0 /100 | #78 | Exceptional 4.4% |
Demographics Similar to Immigrants from Ukraine by Unemployment Among Ages 35 to 44 years
In terms of unemployment among ages 35 to 44 years, the demographic groups most similar to Immigrants from Ukraine are Ugandan (4.8%, a difference of 0.0%), Immigrants from Middle Africa (4.8%, a difference of 0.050%), Immigrants from Afghanistan (4.8%, a difference of 0.13%), Immigrants from Thailand (4.8%, a difference of 0.15%), and Uruguayan (4.8%, a difference of 0.15%).
| Demographics | Rating | Rank | Unemployment Among Ages 35 to 44 years |
| Spanish | 30.4 /100 | #193 | Fair 4.8% |
| Koreans | 28.1 /100 | #194 | Fair 4.8% |
| Bangladeshis | 28.0 /100 | #195 | Fair 4.8% |
| Immigrants | Syria | 23.6 /100 | #196 | Fair 4.8% |
| Immigrants | Oceania | 23.2 /100 | #197 | Fair 4.8% |
| Immigrants | Thailand | 22.9 /100 | #198 | Fair 4.8% |
| Immigrants | Middle Africa | 21.9 /100 | #199 | Fair 4.8% |
| Immigrants | Ukraine | 21.4 /100 | #200 | Fair 4.8% |
| Ugandans | 21.4 /100 | #201 | Fair 4.8% |
| Immigrants | Afghanistan | 20.2 /100 | #202 | Fair 4.8% |
| Uruguayans | 20.0 /100 | #203 | Fair 4.8% |
| Immigrants | Philippines | 19.8 /100 | #204 | Poor 4.8% |
| Spaniards | 18.7 /100 | #205 | Poor 4.8% |
| Soviet Union | 18.4 /100 | #206 | Poor 4.8% |
| Immigrants | Western Asia | 16.6 /100 | #207 | Poor 4.8% |