Immigrants from Liberia vs Immigrants from India Unemployment Among Ages 30 to 34 years
COMPARE
Immigrants from Liberia
Immigrants from India
Unemployment Among Ages 30 to 34 years
Unemployment Among Ages 30 to 34 years Comparison
Immigrants from Liberia
Immigrants from India
6.0%
UNEMPLOYMENT AMONG AGES 30 TO 34 YEARS
0.4/ 100
METRIC RATING
243rd/ 347
METRIC RANK
4.5%
UNEMPLOYMENT AMONG AGES 30 TO 34 YEARS
100.0/ 100
METRIC RATING
1st/ 347
METRIC RANK
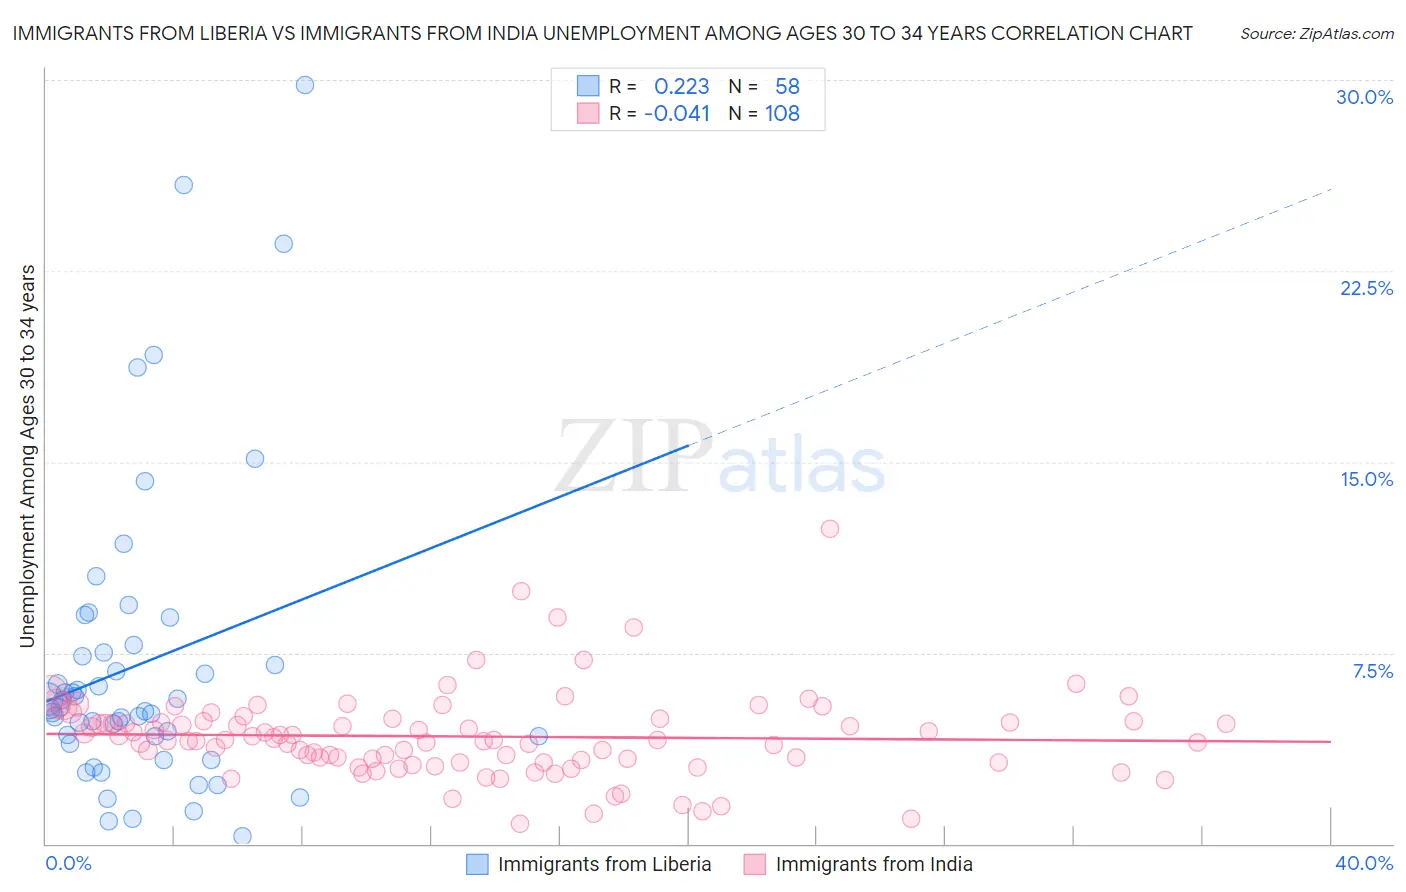
Immigrants from Liberia vs Immigrants from India Unemployment Among Ages 30 to 34 years Correlation Chart
The statistical analysis conducted on geographies consisting of 133,386,885 people shows a weak positive correlation between the proportion of Immigrants from Liberia and unemployment rate among population between the ages 30 and 34 in the United States with a correlation coefficient (R) of 0.223 and weighted average of 6.0%. Similarly, the statistical analysis conducted on geographies consisting of 406,040,304 people shows no correlation between the proportion of Immigrants from India and unemployment rate among population between the ages 30 and 34 in the United States with a correlation coefficient (R) of -0.041 and weighted average of 4.5%, a difference of 33.6%.
Unemployment Among Ages 30 to 34 years Correlation Summary
| Measurement | Immigrants from Liberia | Immigrants from India |
| Minimum | 0.30% | 0.80% |
| Maximum | 29.8% | 12.4% |
| Range | 29.5% | 11.6% |
| Mean | 7.1% | 4.2% |
| Median | 5.3% | 4.1% |
| Interquartile 25% (IQ1) | 4.2% | 3.2% |
| Interquartile 75% (IQ3) | 7.5% | 4.8% |
| Interquartile Range (IQR) | 3.3% | 1.6% |
| Standard Deviation (Sample) | 6.0% | 1.7% |
| Standard Deviation (Population) | 5.9% | 1.7% |
Similar Demographics by Unemployment Among Ages 30 to 34 years
Demographics Similar to Immigrants from Liberia by Unemployment Among Ages 30 to 34 years
In terms of unemployment among ages 30 to 34 years, the demographic groups most similar to Immigrants from Liberia are Guatemalan (6.0%, a difference of 0.060%), Immigrants from Micronesia (6.0%, a difference of 0.15%), Subsaharan African (6.0%, a difference of 0.18%), Immigrants from El Salvador (6.0%, a difference of 0.28%), and Salvadoran (6.0%, a difference of 0.36%).
| Demographics | Rating | Rank | Unemployment Among Ages 30 to 34 years |
| Native Hawaiians | 0.7 /100 | #236 | Tragic 5.9% |
| Central Americans | 0.6 /100 | #237 | Tragic 5.9% |
| Mexican American Indians | 0.6 /100 | #238 | Tragic 5.9% |
| Immigrants | Nigeria | 0.6 /100 | #239 | Tragic 6.0% |
| Salvadorans | 0.5 /100 | #240 | Tragic 6.0% |
| Immigrants | El Salvador | 0.5 /100 | #241 | Tragic 6.0% |
| Guatemalans | 0.4 /100 | #242 | Tragic 6.0% |
| Immigrants | Liberia | 0.4 /100 | #243 | Tragic 6.0% |
| Immigrants | Micronesia | 0.3 /100 | #244 | Tragic 6.0% |
| Sub-Saharan Africans | 0.3 /100 | #245 | Tragic 6.0% |
| Ghanaians | 0.3 /100 | #246 | Tragic 6.0% |
| Nigerians | 0.3 /100 | #247 | Tragic 6.0% |
| Immigrants | Guatemala | 0.3 /100 | #248 | Tragic 6.0% |
| Hondurans | 0.3 /100 | #249 | Tragic 6.0% |
| Immigrants | Honduras | 0.3 /100 | #250 | Tragic 6.0% |
Demographics Similar to Immigrants from India by Unemployment Among Ages 30 to 34 years
In terms of unemployment among ages 30 to 34 years, the demographic groups most similar to Immigrants from India are Sudanese (4.6%, a difference of 1.8%), Immigrants from Venezuela (4.6%, a difference of 3.5%), Immigrants from Nepal (4.7%, a difference of 4.2%), Venezuelan (4.7%, a difference of 4.8%), and Immigrants from Bosnia and Herzegovina (4.7%, a difference of 5.1%).
| Demographics | Rating | Rank | Unemployment Among Ages 30 to 34 years |
| Immigrants | India | 100.0 /100 | #1 | Exceptional 4.5% |
| Sudanese | 100.0 /100 | #2 | Exceptional 4.6% |
| Immigrants | Venezuela | 100.0 /100 | #3 | Exceptional 4.6% |
| Immigrants | Nepal | 100.0 /100 | #4 | Exceptional 4.7% |
| Venezuelans | 100.0 /100 | #5 | Exceptional 4.7% |
| Immigrants | Bosnia and Herzegovina | 100.0 /100 | #6 | Exceptional 4.7% |
| Thais | 100.0 /100 | #7 | Exceptional 4.7% |
| Immigrants | Eritrea | 100.0 /100 | #8 | Exceptional 4.7% |
| Bulgarians | 99.9 /100 | #9 | Exceptional 4.7% |
| Tongans | 99.9 /100 | #10 | Exceptional 4.8% |
| Immigrants | Bolivia | 99.9 /100 | #11 | Exceptional 4.8% |
| Filipinos | 99.9 /100 | #12 | Exceptional 4.8% |
| Cambodians | 99.9 /100 | #13 | Exceptional 4.8% |
| Luxembourgers | 99.9 /100 | #14 | Exceptional 4.8% |
| Okinawans | 99.9 /100 | #15 | Exceptional 4.8% |