Immigrants from Liberia vs Immigrants from Congo Unemployment Among Ages 16 to 19 years
COMPARE
Immigrants from Liberia
Immigrants from Congo
Unemployment Among Ages 16 to 19 years
Unemployment Among Ages 16 to 19 years Comparison
Immigrants from Liberia
Immigrants from Congo
18.1%
UNEMPLOYMENT AMONG AGES 16 TO 19 YEARS
7.1/ 100
METRIC RATING
227th/ 347
METRIC RANK
16.3%
UNEMPLOYMENT AMONG AGES 16 TO 19 YEARS
99.8/ 100
METRIC RATING
37th/ 347
METRIC RANK
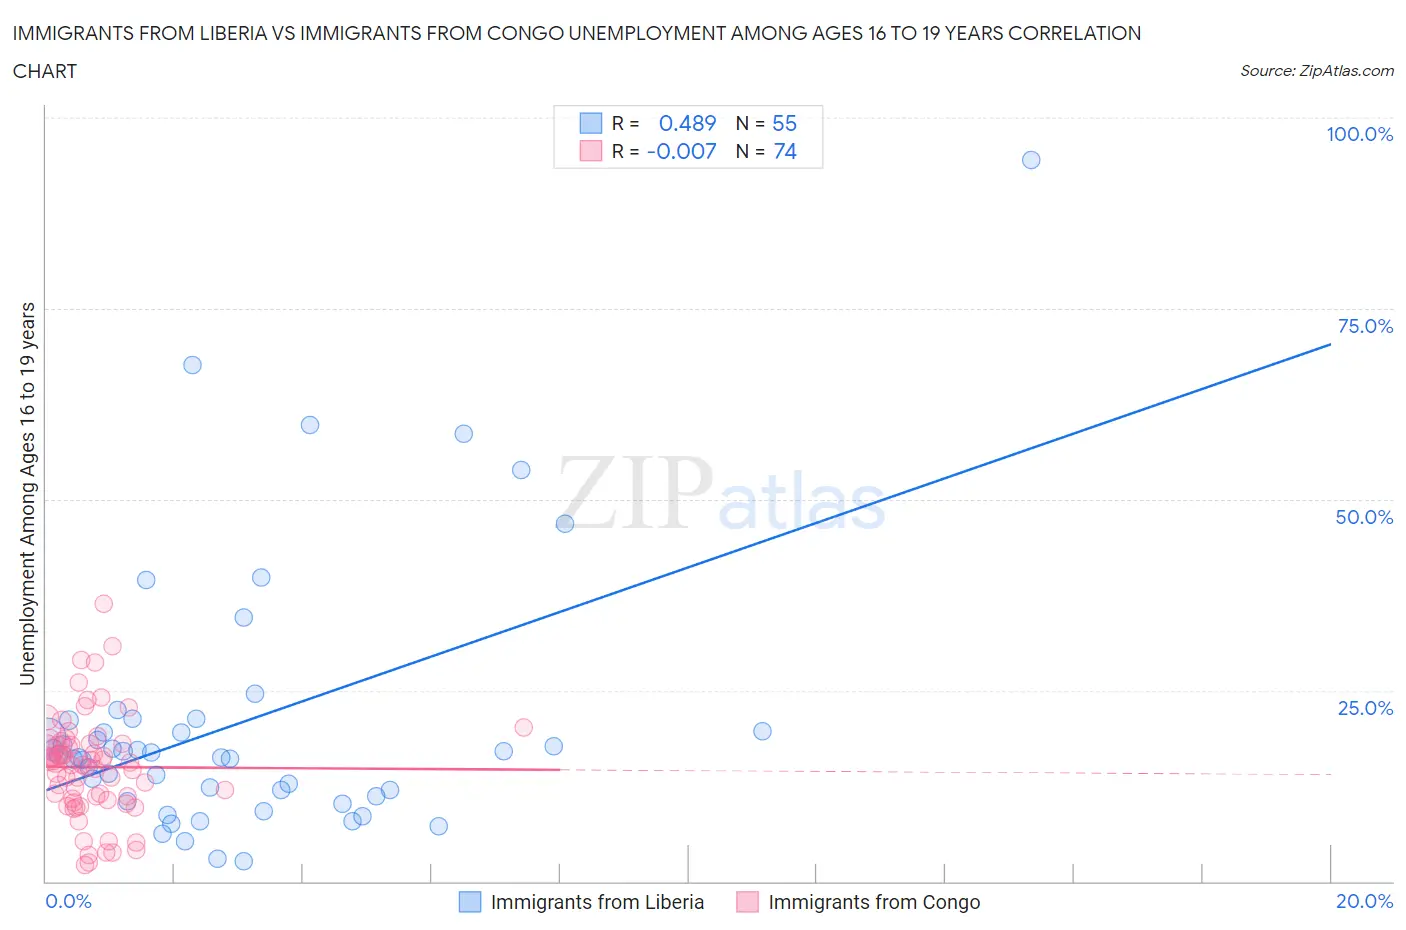
Immigrants from Liberia vs Immigrants from Congo Unemployment Among Ages 16 to 19 years Correlation Chart
The statistical analysis conducted on geographies consisting of 133,284,598 people shows a moderate positive correlation between the proportion of Immigrants from Liberia and unemployment rate among population between the ages 16 and 19 in the United States with a correlation coefficient (R) of 0.489 and weighted average of 18.1%. Similarly, the statistical analysis conducted on geographies consisting of 91,550,138 people shows no correlation between the proportion of Immigrants from Congo and unemployment rate among population between the ages 16 and 19 in the United States with a correlation coefficient (R) of -0.007 and weighted average of 16.3%, a difference of 11.4%.
Unemployment Among Ages 16 to 19 years Correlation Summary
| Measurement | Immigrants from Liberia | Immigrants from Congo |
| Minimum | 2.6% | 2.2% |
| Maximum | 94.4% | 36.3% |
| Range | 91.8% | 34.1% |
| Mean | 20.9% | 15.0% |
| Median | 16.6% | 15.5% |
| Interquartile 25% (IQ1) | 11.2% | 10.7% |
| Interquartile 75% (IQ3) | 21.1% | 17.9% |
| Interquartile Range (IQR) | 9.9% | 7.2% |
| Standard Deviation (Sample) | 17.5% | 6.6% |
| Standard Deviation (Population) | 17.3% | 6.6% |
Similar Demographics by Unemployment Among Ages 16 to 19 years
Demographics Similar to Immigrants from Liberia by Unemployment Among Ages 16 to 19 years
In terms of unemployment among ages 16 to 19 years, the demographic groups most similar to Immigrants from Liberia are Immigrants from Greece (18.1%, a difference of 0.010%), Immigrants from Belgium (18.1%, a difference of 0.020%), Immigrants from Chile (18.1%, a difference of 0.060%), Immigrants from Serbia (18.1%, a difference of 0.18%), and Albanian (18.2%, a difference of 0.26%).
| Demographics | Rating | Rank | Unemployment Among Ages 16 to 19 years |
| Immigrants | Albania | 11.4 /100 | #220 | Poor 18.0% |
| Immigrants | Spain | 11.4 /100 | #221 | Poor 18.0% |
| Immigrants | Iran | 10.7 /100 | #222 | Poor 18.0% |
| Immigrants | Western Asia | 10.2 /100 | #223 | Poor 18.0% |
| Immigrants | Serbia | 8.3 /100 | #224 | Tragic 18.1% |
| Immigrants | Chile | 7.5 /100 | #225 | Tragic 18.1% |
| Immigrants | Belgium | 7.3 /100 | #226 | Tragic 18.1% |
| Immigrants | Liberia | 7.1 /100 | #227 | Tragic 18.1% |
| Immigrants | Greece | 7.1 /100 | #228 | Tragic 18.1% |
| Albanians | 5.8 /100 | #229 | Tragic 18.2% |
| Spanish Americans | 4.7 /100 | #230 | Tragic 18.2% |
| Nepalese | 4.2 /100 | #231 | Tragic 18.2% |
| Immigrants | Russia | 4.0 /100 | #232 | Tragic 18.2% |
| Seminole | 4.0 /100 | #233 | Tragic 18.2% |
| Colombians | 3.7 /100 | #234 | Tragic 18.3% |
Demographics Similar to Immigrants from Congo by Unemployment Among Ages 16 to 19 years
In terms of unemployment among ages 16 to 19 years, the demographic groups most similar to Immigrants from Congo are Bulgarian (16.3%, a difference of 0.020%), Immigrants from South Central Asia (16.2%, a difference of 0.10%), Scottish (16.2%, a difference of 0.12%), Croatian (16.3%, a difference of 0.13%), and Hmong (16.3%, a difference of 0.24%).
| Demographics | Rating | Rank | Unemployment Among Ages 16 to 19 years |
| Kenyans | 99.9 /100 | #30 | Exceptional 16.1% |
| English | 99.9 /100 | #31 | Exceptional 16.1% |
| Europeans | 99.9 /100 | #32 | Exceptional 16.1% |
| Immigrants | Kenya | 99.9 /100 | #33 | Exceptional 16.2% |
| Pennsylvania Germans | 99.9 /100 | #34 | Exceptional 16.2% |
| Scottish | 99.8 /100 | #35 | Exceptional 16.2% |
| Immigrants | South Central Asia | 99.8 /100 | #36 | Exceptional 16.2% |
| Immigrants | Congo | 99.8 /100 | #37 | Exceptional 16.3% |
| Bulgarians | 99.8 /100 | #38 | Exceptional 16.3% |
| Croatians | 99.8 /100 | #39 | Exceptional 16.3% |
| Hmong | 99.8 /100 | #40 | Exceptional 16.3% |
| Immigrants | Nepal | 99.8 /100 | #41 | Exceptional 16.3% |
| Fijians | 99.8 /100 | #42 | Exceptional 16.3% |
| Immigrants | Lebanon | 99.8 /100 | #43 | Exceptional 16.3% |
| Immigrants | Zimbabwe | 99.7 /100 | #44 | Exceptional 16.3% |