Immigrants from Lebanon vs Liberian Unemployment Among Ages 55 to 59 years
COMPARE
Immigrants from Lebanon
Liberian
Unemployment Among Ages 55 to 59 years
Unemployment Among Ages 55 to 59 years Comparison
Immigrants from Lebanon
Liberians
4.8%
UNEMPLOYMENT AMONG AGES 55 TO 59 YEARS
63.8/ 100
METRIC RATING
163rd/ 347
METRIC RANK
5.1%
UNEMPLOYMENT AMONG AGES 55 TO 59 YEARS
0.9/ 100
METRIC RATING
242nd/ 347
METRIC RANK
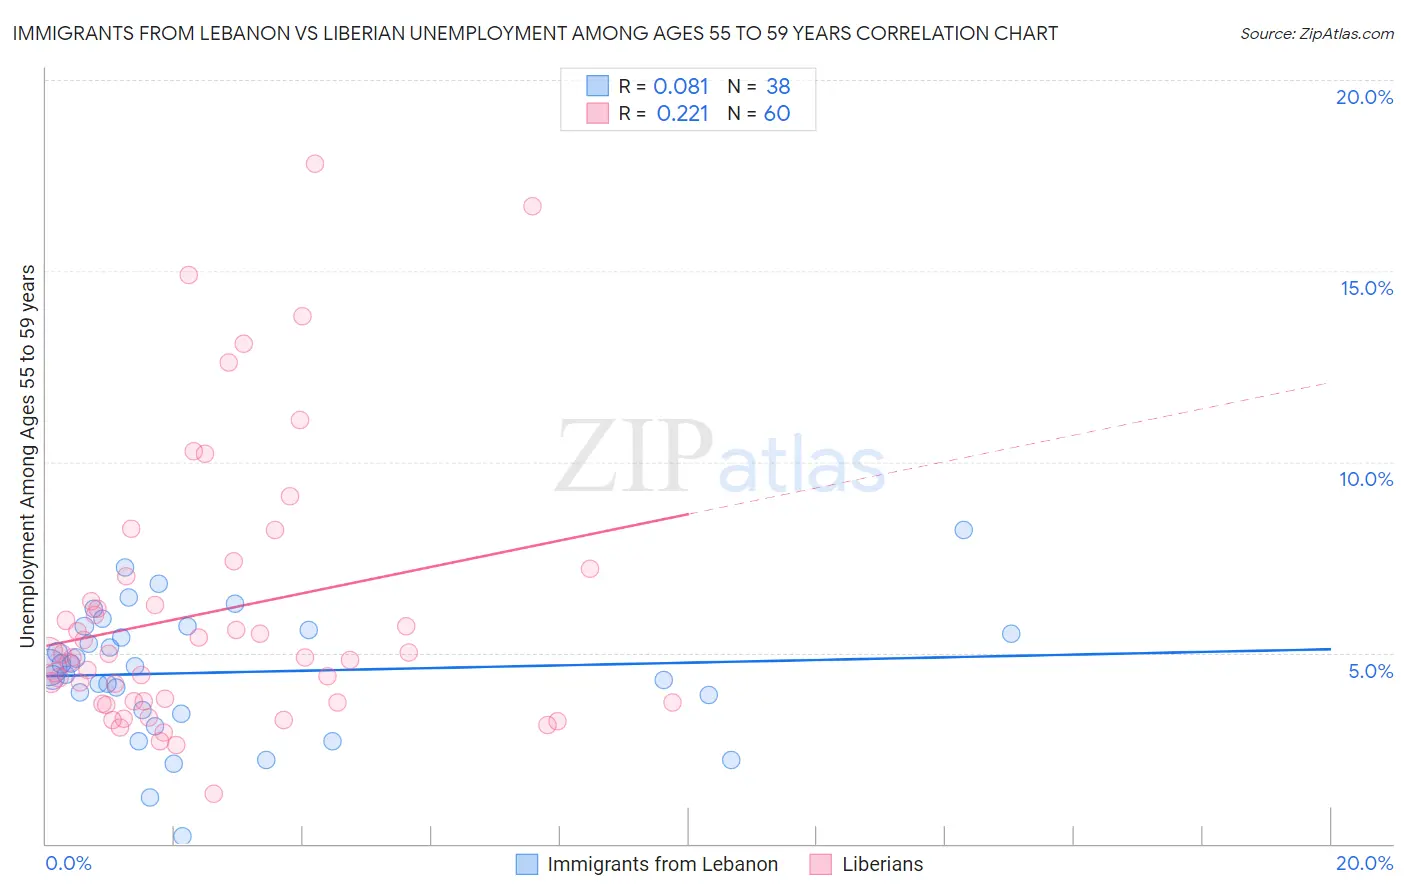
Immigrants from Lebanon vs Liberian Unemployment Among Ages 55 to 59 years Correlation Chart
The statistical analysis conducted on geographies consisting of 211,002,153 people shows a slight positive correlation between the proportion of Immigrants from Lebanon and unemployment rate among population between the ages 55 and 59 in the United States with a correlation coefficient (R) of 0.081 and weighted average of 4.8%. Similarly, the statistical analysis conducted on geographies consisting of 115,549,867 people shows a weak positive correlation between the proportion of Liberians and unemployment rate among population between the ages 55 and 59 in the United States with a correlation coefficient (R) of 0.221 and weighted average of 5.1%, a difference of 5.4%.
Unemployment Among Ages 55 to 59 years Correlation Summary
| Measurement | Immigrants from Lebanon | Liberian |
| Minimum | 0.20% | 1.3% |
| Maximum | 8.2% | 17.8% |
| Range | 8.0% | 16.5% |
| Mean | 4.5% | 6.1% |
| Median | 4.6% | 4.9% |
| Interquartile 25% (IQ1) | 3.5% | 3.7% |
| Interquartile 75% (IQ3) | 5.6% | 6.7% |
| Interquartile Range (IQR) | 2.1% | 3.0% |
| Standard Deviation (Sample) | 1.7% | 3.6% |
| Standard Deviation (Population) | 1.6% | 3.5% |
Similar Demographics by Unemployment Among Ages 55 to 59 years
Demographics Similar to Immigrants from Lebanon by Unemployment Among Ages 55 to 59 years
In terms of unemployment among ages 55 to 59 years, the demographic groups most similar to Immigrants from Lebanon are Immigrants from Africa (4.8%, a difference of 0.020%), American (4.8%, a difference of 0.020%), Korean (4.8%, a difference of 0.030%), Immigrants from Nicaragua (4.8%, a difference of 0.060%), and Chickasaw (4.8%, a difference of 0.060%).
| Demographics | Rating | Rank | Unemployment Among Ages 55 to 59 years |
| Italians | 66.2 /100 | #156 | Good 4.8% |
| Carpatho Rusyns | 66.0 /100 | #157 | Good 4.8% |
| Slovaks | 65.3 /100 | #158 | Good 4.8% |
| Immigrants | Nicaragua | 65.2 /100 | #159 | Good 4.8% |
| Chickasaw | 65.1 /100 | #160 | Good 4.8% |
| Koreans | 64.6 /100 | #161 | Good 4.8% |
| Immigrants | Africa | 64.2 /100 | #162 | Good 4.8% |
| Immigrants | Lebanon | 63.8 /100 | #163 | Good 4.8% |
| Americans | 63.3 /100 | #164 | Good 4.8% |
| Immigrants | France | 62.0 /100 | #165 | Good 4.8% |
| Potawatomi | 62.0 /100 | #166 | Good 4.8% |
| Immigrants | Western Europe | 60.4 /100 | #167 | Good 4.8% |
| Immigrants | Cambodia | 59.3 /100 | #168 | Average 4.8% |
| Immigrants | Sudan | 58.4 /100 | #169 | Average 4.8% |
| Uruguayans | 55.6 /100 | #170 | Average 4.8% |
Demographics Similar to Liberians by Unemployment Among Ages 55 to 59 years
In terms of unemployment among ages 55 to 59 years, the demographic groups most similar to Liberians are Brazilian (5.0%, a difference of 0.18%), Honduran (5.1%, a difference of 0.21%), Immigrants from Costa Rica (5.0%, a difference of 0.22%), Immigrants from Fiji (5.1%, a difference of 0.22%), and French American Indian (5.0%, a difference of 0.35%).
| Demographics | Rating | Rank | Unemployment Among Ages 55 to 59 years |
| Immigrants | Hong Kong | 1.4 /100 | #235 | Tragic 5.0% |
| Immigrants | Albania | 1.3 /100 | #236 | Tragic 5.0% |
| Choctaw | 1.3 /100 | #237 | Tragic 5.0% |
| Moroccans | 1.3 /100 | #238 | Tragic 5.0% |
| French American Indians | 1.2 /100 | #239 | Tragic 5.0% |
| Immigrants | Costa Rica | 1.1 /100 | #240 | Tragic 5.0% |
| Brazilians | 1.0 /100 | #241 | Tragic 5.0% |
| Liberians | 0.9 /100 | #242 | Tragic 5.1% |
| Hondurans | 0.7 /100 | #243 | Tragic 5.1% |
| Immigrants | Fiji | 0.7 /100 | #244 | Tragic 5.1% |
| Soviet Union | 0.6 /100 | #245 | Tragic 5.1% |
| Immigrants | Greece | 0.6 /100 | #246 | Tragic 5.1% |
| Immigrants | Honduras | 0.5 /100 | #247 | Tragic 5.1% |
| Native Hawaiians | 0.5 /100 | #248 | Tragic 5.1% |
| Comanche | 0.4 /100 | #249 | Tragic 5.1% |