Immigrants from Lebanon vs Immigrants from Saudi Arabia Unemployment Among Ages 16 to 19 years
COMPARE
Immigrants from Lebanon
Immigrants from Saudi Arabia
Unemployment Among Ages 16 to 19 years
Unemployment Among Ages 16 to 19 years Comparison
Immigrants from Lebanon
Immigrants from Saudi Arabia
16.3%
UNEMPLOYMENT AMONG AGES 16 TO 19 YEARS
99.8/ 100
METRIC RATING
43rd/ 347
METRIC RANK
17.0%
UNEMPLOYMENT AMONG AGES 16 TO 19 YEARS
94.7/ 100
METRIC RATING
101st/ 347
METRIC RANK
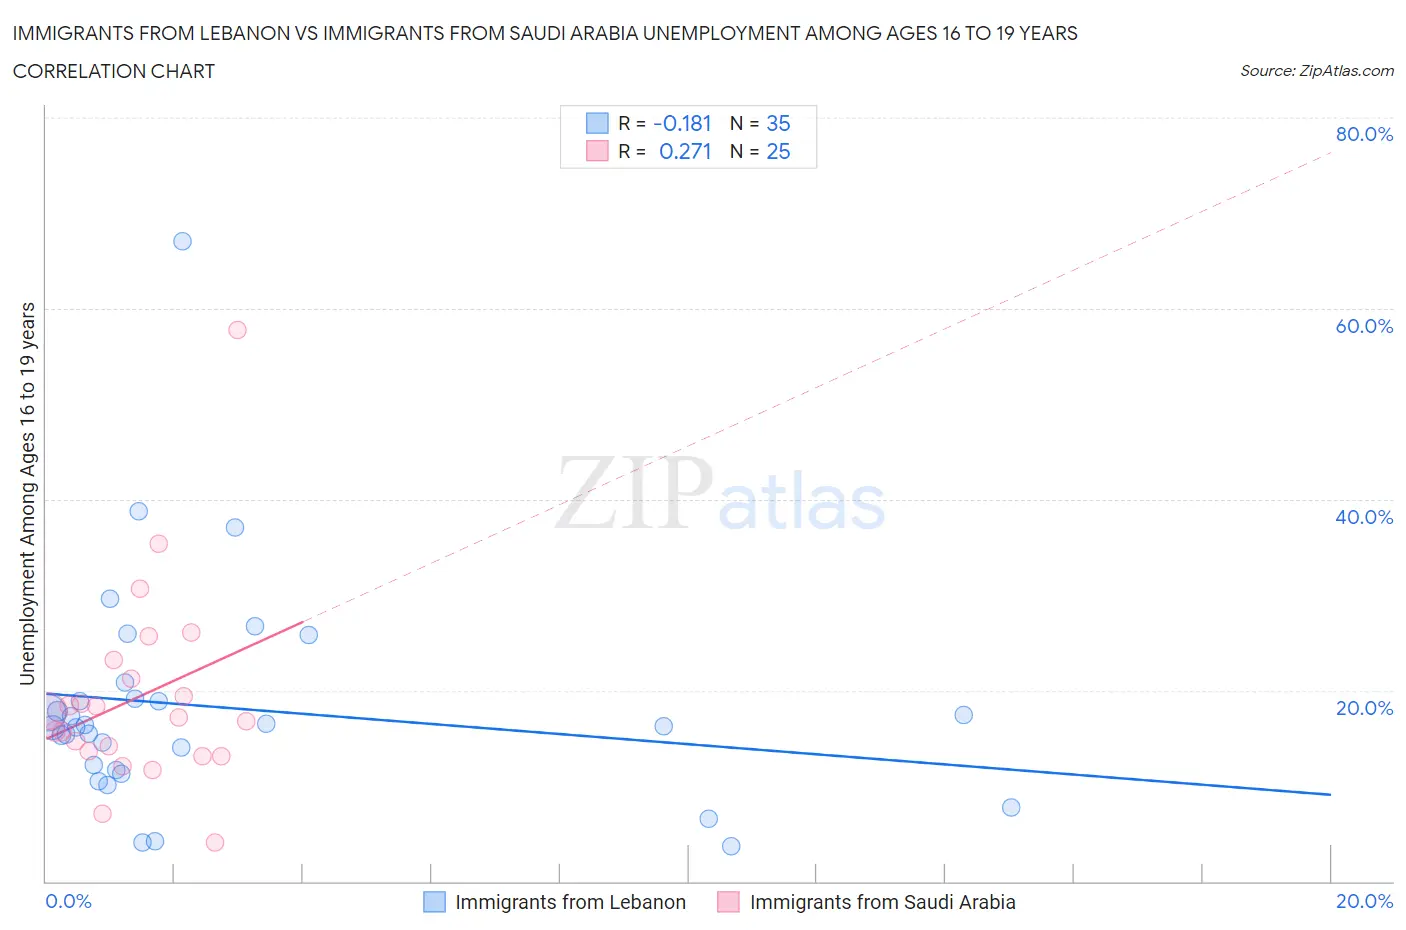
Immigrants from Lebanon vs Immigrants from Saudi Arabia Unemployment Among Ages 16 to 19 years Correlation Chart
The statistical analysis conducted on geographies consisting of 210,748,675 people shows a poor negative correlation between the proportion of Immigrants from Lebanon and unemployment rate among population between the ages 16 and 19 in the United States with a correlation coefficient (R) of -0.181 and weighted average of 16.3%. Similarly, the statistical analysis conducted on geographies consisting of 161,069,022 people shows a weak positive correlation between the proportion of Immigrants from Saudi Arabia and unemployment rate among population between the ages 16 and 19 in the United States with a correlation coefficient (R) of 0.271 and weighted average of 17.0%, a difference of 4.0%.
Unemployment Among Ages 16 to 19 years Correlation Summary
| Measurement | Immigrants from Lebanon | Immigrants from Saudi Arabia |
| Minimum | 3.7% | 4.1% |
| Maximum | 67.0% | 57.8% |
| Range | 63.3% | 53.7% |
| Mean | 18.2% | 19.2% |
| Median | 16.2% | 17.1% |
| Interquartile 25% (IQ1) | 11.7% | 13.4% |
| Interquartile 75% (IQ3) | 19.1% | 22.2% |
| Interquartile Range (IQR) | 7.4% | 8.9% |
| Standard Deviation (Sample) | 11.7% | 10.5% |
| Standard Deviation (Population) | 11.6% | 10.3% |
Similar Demographics by Unemployment Among Ages 16 to 19 years
Demographics Similar to Immigrants from Lebanon by Unemployment Among Ages 16 to 19 years
In terms of unemployment among ages 16 to 19 years, the demographic groups most similar to Immigrants from Lebanon are Fijian (16.3%, a difference of 0.070%), Immigrants from Nepal (16.3%, a difference of 0.10%), Immigrants from Zimbabwe (16.3%, a difference of 0.13%), Polish (16.4%, a difference of 0.14%), and Immigrants from North Macedonia (16.4%, a difference of 0.16%).
| Demographics | Rating | Rank | Unemployment Among Ages 16 to 19 years |
| Immigrants | South Central Asia | 99.8 /100 | #36 | Exceptional 16.2% |
| Immigrants | Congo | 99.8 /100 | #37 | Exceptional 16.3% |
| Bulgarians | 99.8 /100 | #38 | Exceptional 16.3% |
| Croatians | 99.8 /100 | #39 | Exceptional 16.3% |
| Hmong | 99.8 /100 | #40 | Exceptional 16.3% |
| Immigrants | Nepal | 99.8 /100 | #41 | Exceptional 16.3% |
| Fijians | 99.8 /100 | #42 | Exceptional 16.3% |
| Immigrants | Lebanon | 99.8 /100 | #43 | Exceptional 16.3% |
| Immigrants | Zimbabwe | 99.7 /100 | #44 | Exceptional 16.3% |
| Poles | 99.7 /100 | #45 | Exceptional 16.4% |
| Immigrants | North Macedonia | 99.7 /100 | #46 | Exceptional 16.4% |
| Immigrants | Vietnam | 99.7 /100 | #47 | Exceptional 16.4% |
| Maltese | 99.7 /100 | #48 | Exceptional 16.4% |
| Iraqis | 99.7 /100 | #49 | Exceptional 16.4% |
| Bhutanese | 99.6 /100 | #50 | Exceptional 16.4% |
Demographics Similar to Immigrants from Saudi Arabia by Unemployment Among Ages 16 to 19 years
In terms of unemployment among ages 16 to 19 years, the demographic groups most similar to Immigrants from Saudi Arabia are Immigrants from Thailand (17.0%, a difference of 0.010%), Immigrants from Pakistan (17.0%, a difference of 0.020%), Palestinian (17.0%, a difference of 0.030%), Italian (17.0%, a difference of 0.040%), and Immigrants from Lithuania (17.0%, a difference of 0.050%).
| Demographics | Rating | Rank | Unemployment Among Ages 16 to 19 years |
| Bangladeshis | 95.8 /100 | #94 | Exceptional 16.9% |
| Mongolians | 95.6 /100 | #95 | Exceptional 16.9% |
| Ottawa | 95.4 /100 | #96 | Exceptional 16.9% |
| Immigrants | Venezuela | 95.3 /100 | #97 | Exceptional 16.9% |
| Burmese | 95.0 /100 | #98 | Exceptional 17.0% |
| Immigrants | Lithuania | 94.9 /100 | #99 | Exceptional 17.0% |
| Immigrants | Thailand | 94.7 /100 | #100 | Exceptional 17.0% |
| Immigrants | Saudi Arabia | 94.7 /100 | #101 | Exceptional 17.0% |
| Immigrants | Pakistan | 94.6 /100 | #102 | Exceptional 17.0% |
| Palestinians | 94.6 /100 | #103 | Exceptional 17.0% |
| Italians | 94.5 /100 | #104 | Exceptional 17.0% |
| Immigrants | Bulgaria | 94.3 /100 | #105 | Exceptional 17.0% |
| Estonians | 94.3 /100 | #106 | Exceptional 17.0% |
| Immigrants | Brazil | 94.2 /100 | #107 | Exceptional 17.0% |
| Malaysians | 94.2 /100 | #108 | Exceptional 17.0% |