Immigrants from Latin America vs Paraguayan Unemployment Among Seniors over 75 years
COMPARE
Immigrants from Latin America
Paraguayan
Unemployment Among Seniors over 75 years
Unemployment Among Seniors over 75 years Comparison
Immigrants from Latin America
Paraguayans
9.0%
UNEMPLOYMENT AMONG SENIORS OVER 75 YEARS
13.4/ 100
METRIC RATING
213th/ 347
METRIC RANK
8.7%
UNEMPLOYMENT AMONG SENIORS OVER 75 YEARS
62.2/ 100
METRIC RATING
164th/ 347
METRIC RANK
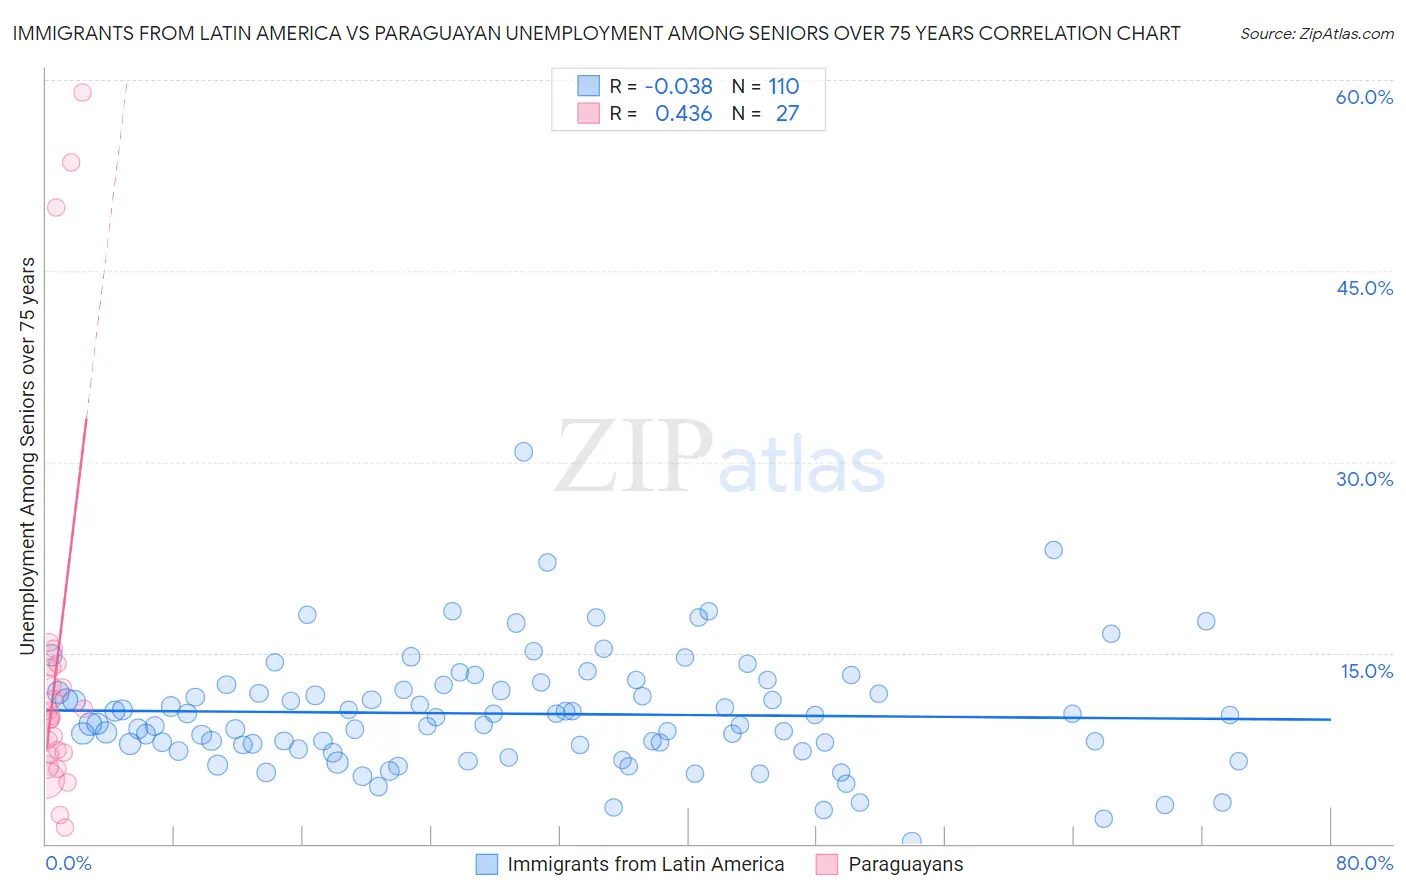
Immigrants from Latin America vs Paraguayan Unemployment Among Seniors over 75 years Correlation Chart
The statistical analysis conducted on geographies consisting of 234,389,165 people shows no correlation between the proportion of Immigrants from Latin America and unemployment rate among seniors over the age of 75 in the United States with a correlation coefficient (R) of -0.038 and weighted average of 9.0%. Similarly, the statistical analysis conducted on geographies consisting of 73,453,572 people shows a moderate positive correlation between the proportion of Paraguayans and unemployment rate among seniors over the age of 75 in the United States with a correlation coefficient (R) of 0.436 and weighted average of 8.7%, a difference of 3.2%.
Unemployment Among Seniors over 75 years Correlation Summary
| Measurement | Immigrants from Latin America | Paraguayan |
| Minimum | 0.20% | 1.3% |
| Maximum | 30.8% | 59.0% |
| Range | 30.6% | 57.7% |
| Mean | 10.2% | 14.3% |
| Median | 9.7% | 10.0% |
| Interquartile 25% (IQ1) | 7.8% | 7.0% |
| Interquartile 75% (IQ3) | 12.1% | 13.8% |
| Interquartile Range (IQR) | 4.3% | 6.8% |
| Standard Deviation (Sample) | 4.6% | 14.9% |
| Standard Deviation (Population) | 4.6% | 14.6% |
Similar Demographics by Unemployment Among Seniors over 75 years
Demographics Similar to Immigrants from Latin America by Unemployment Among Seniors over 75 years
In terms of unemployment among seniors over 75 years, the demographic groups most similar to Immigrants from Latin America are Immigrants from Brazil (9.0%, a difference of 0.020%), Romanian (9.0%, a difference of 0.040%), Immigrants from Western Asia (9.0%, a difference of 0.11%), Delaware (9.0%, a difference of 0.12%), and Bermudan (8.9%, a difference of 0.17%).
| Demographics | Rating | Rank | Unemployment Among Seniors over 75 years |
| Immigrants | Western Europe | 18.2 /100 | #206 | Poor 8.9% |
| Malaysians | 16.3 /100 | #207 | Poor 8.9% |
| Immigrants | Philippines | 15.8 /100 | #208 | Poor 8.9% |
| Salvadorans | 15.4 /100 | #209 | Poor 8.9% |
| Bermudans | 15.0 /100 | #210 | Poor 8.9% |
| Delaware | 14.6 /100 | #211 | Poor 9.0% |
| Romanians | 13.8 /100 | #212 | Poor 9.0% |
| Immigrants | Latin America | 13.4 /100 | #213 | Poor 9.0% |
| Immigrants | Brazil | 13.3 /100 | #214 | Poor 9.0% |
| Immigrants | Western Asia | 12.5 /100 | #215 | Poor 9.0% |
| Immigrants | Oceania | 11.8 /100 | #216 | Poor 9.0% |
| Lebanese | 11.1 /100 | #217 | Poor 9.0% |
| Immigrants | Africa | 9.7 /100 | #218 | Tragic 9.0% |
| Afghans | 8.3 /100 | #219 | Tragic 9.0% |
| Immigrants | Zimbabwe | 7.8 /100 | #220 | Tragic 9.0% |
Demographics Similar to Paraguayans by Unemployment Among Seniors over 75 years
In terms of unemployment among seniors over 75 years, the demographic groups most similar to Paraguayans are Immigrants from Dominican Republic (8.7%, a difference of 0.040%), Immigrants from Belize (8.7%, a difference of 0.26%), Immigrants from Eastern Africa (8.7%, a difference of 0.26%), Immigrants from Lithuania (8.7%, a difference of 0.28%), and Fijian (8.7%, a difference of 0.32%).
| Demographics | Rating | Rank | Unemployment Among Seniors over 75 years |
| Turks | 76.4 /100 | #157 | Good 8.6% |
| Ethiopians | 75.3 /100 | #158 | Good 8.6% |
| Shoshone | 74.6 /100 | #159 | Good 8.6% |
| Cree | 72.8 /100 | #160 | Good 8.6% |
| Albanians | 72.8 /100 | #161 | Good 8.6% |
| Immigrants | South America | 71.3 /100 | #162 | Good 8.6% |
| Immigrants | Guatemala | 68.4 /100 | #163 | Good 8.7% |
| Paraguayans | 62.2 /100 | #164 | Good 8.7% |
| Immigrants | Dominican Republic | 61.4 /100 | #165 | Good 8.7% |
| Immigrants | Belize | 57.6 /100 | #166 | Average 8.7% |
| Immigrants | Eastern Africa | 57.6 /100 | #167 | Average 8.7% |
| Immigrants | Lithuania | 57.2 /100 | #168 | Average 8.7% |
| Fijians | 56.4 /100 | #169 | Average 8.7% |
| Zimbabweans | 54.1 /100 | #170 | Average 8.7% |
| Dominicans | 51.9 /100 | #171 | Average 8.7% |