Immigrants from Latin America vs Immigrants from Burma/Myanmar Unemployment Among Ages 16 to 19 years
COMPARE
Immigrants from Latin America
Immigrants from Burma/Myanmar
Unemployment Among Ages 16 to 19 years
Unemployment Among Ages 16 to 19 years Comparison
Immigrants from Latin America
Immigrants from Burma/Myanmar
19.4%
UNEMPLOYMENT AMONG AGES 16 TO 19 YEARS
0.0/ 100
METRIC RATING
276th/ 347
METRIC RANK
15.6%
UNEMPLOYMENT AMONG AGES 16 TO 19 YEARS
100.0/ 100
METRIC RATING
13th/ 347
METRIC RANK
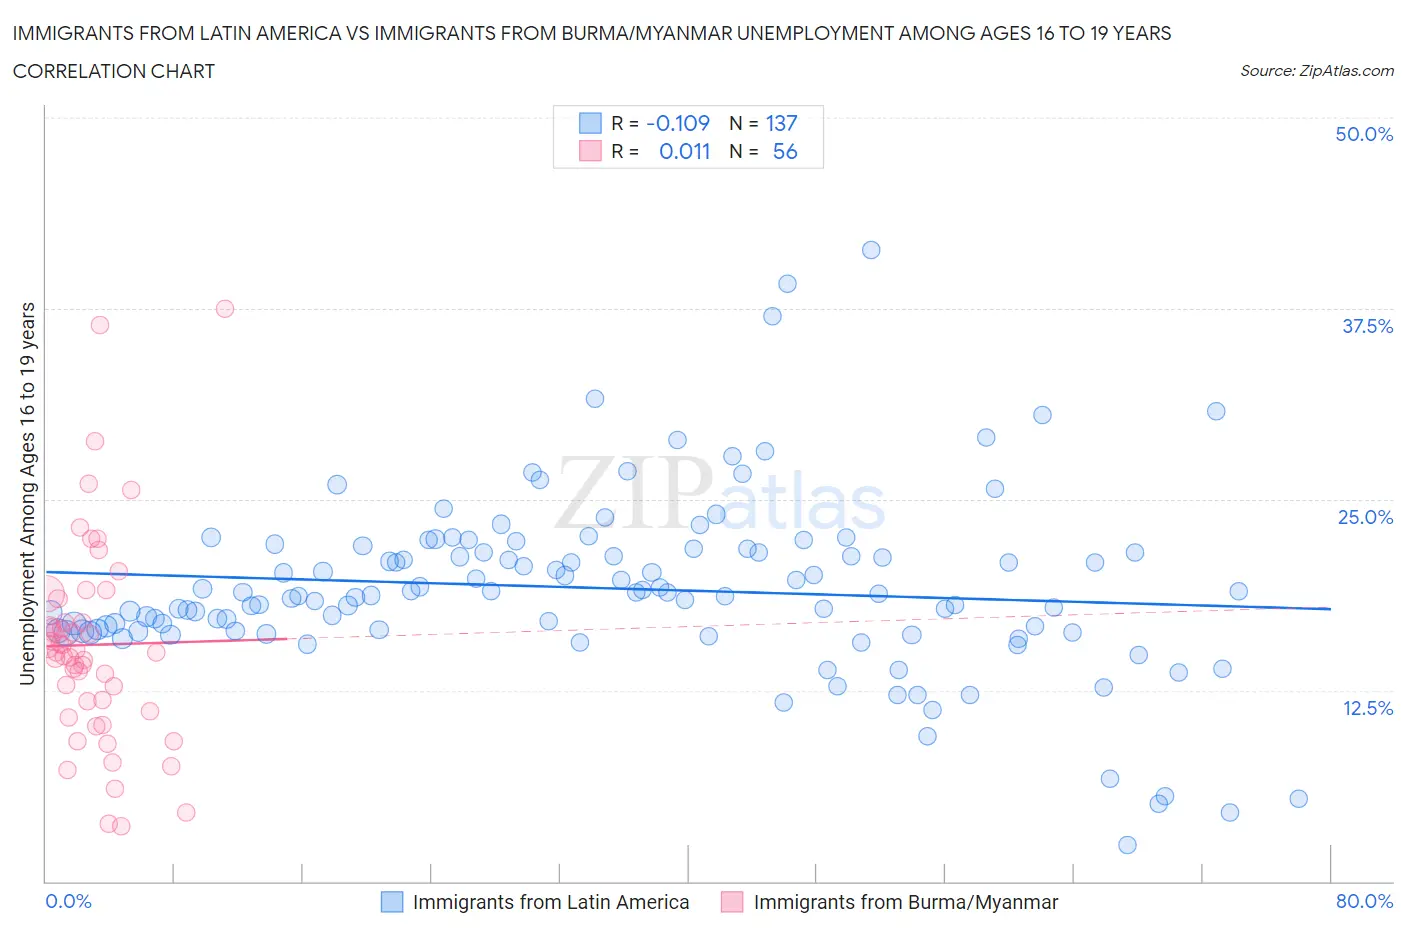
Immigrants from Latin America vs Immigrants from Burma/Myanmar Unemployment Among Ages 16 to 19 years Correlation Chart
The statistical analysis conducted on geographies consisting of 503,848,707 people shows a poor negative correlation between the proportion of Immigrants from Latin America and unemployment rate among population between the ages 16 and 19 in the United States with a correlation coefficient (R) of -0.109 and weighted average of 19.4%. Similarly, the statistical analysis conducted on geographies consisting of 168,780,503 people shows no correlation between the proportion of Immigrants from Burma/Myanmar and unemployment rate among population between the ages 16 and 19 in the United States with a correlation coefficient (R) of 0.011 and weighted average of 15.6%, a difference of 24.3%.
Unemployment Among Ages 16 to 19 years Correlation Summary
| Measurement | Immigrants from Latin America | Immigrants from Burma/Myanmar |
| Minimum | 2.4% | 3.6% |
| Maximum | 41.3% | 37.5% |
| Range | 38.9% | 33.9% |
| Mean | 19.2% | 15.5% |
| Median | 18.9% | 15.0% |
| Interquartile 25% (IQ1) | 16.4% | 11.5% |
| Interquartile 75% (IQ3) | 21.6% | 17.7% |
| Interquartile Range (IQR) | 5.3% | 6.3% |
| Standard Deviation (Sample) | 5.8% | 6.8% |
| Standard Deviation (Population) | 5.8% | 6.7% |
Similar Demographics by Unemployment Among Ages 16 to 19 years
Demographics Similar to Immigrants from Latin America by Unemployment Among Ages 16 to 19 years
In terms of unemployment among ages 16 to 19 years, the demographic groups most similar to Immigrants from Latin America are Paraguayan (19.4%, a difference of 0.090%), Immigrants from Western Africa (19.4%, a difference of 0.33%), Shoshone (19.3%, a difference of 0.42%), African (19.5%, a difference of 0.56%), and Immigrants from Panama (19.3%, a difference of 0.57%).
| Demographics | Rating | Rank | Unemployment Among Ages 16 to 19 years |
| Lumbee | 0.1 /100 | #269 | Tragic 19.1% |
| Hondurans | 0.1 /100 | #270 | Tragic 19.2% |
| Blackfeet | 0.0 /100 | #271 | Tragic 19.2% |
| Hispanics or Latinos | 0.0 /100 | #272 | Tragic 19.2% |
| Immigrants | Panama | 0.0 /100 | #273 | Tragic 19.3% |
| Shoshone | 0.0 /100 | #274 | Tragic 19.3% |
| Paraguayans | 0.0 /100 | #275 | Tragic 19.4% |
| Immigrants | Latin America | 0.0 /100 | #276 | Tragic 19.4% |
| Immigrants | Western Africa | 0.0 /100 | #277 | Tragic 19.4% |
| Africans | 0.0 /100 | #278 | Tragic 19.5% |
| Ute | 0.0 /100 | #279 | Tragic 19.6% |
| Cajuns | 0.0 /100 | #280 | Tragic 19.6% |
| Cypriots | 0.0 /100 | #281 | Tragic 19.6% |
| Dutch West Indians | 0.0 /100 | #282 | Tragic 19.7% |
| Sioux | 0.0 /100 | #283 | Tragic 19.7% |
Demographics Similar to Immigrants from Burma/Myanmar by Unemployment Among Ages 16 to 19 years
In terms of unemployment among ages 16 to 19 years, the demographic groups most similar to Immigrants from Burma/Myanmar are Immigrants from Zaire (15.6%, a difference of 0.14%), Yugoslavian (15.6%, a difference of 0.20%), Taiwanese (15.5%, a difference of 0.43%), German (15.7%, a difference of 0.49%), and Indonesian (15.5%, a difference of 0.53%).
| Demographics | Rating | Rank | Unemployment Among Ages 16 to 19 years |
| Swedes | 100.0 /100 | #6 | Exceptional 15.3% |
| Immigrants | Bosnia and Herzegovina | 100.0 /100 | #7 | Exceptional 15.3% |
| Czechs | 100.0 /100 | #8 | Exceptional 15.4% |
| Scandinavians | 100.0 /100 | #9 | Exceptional 15.4% |
| Zimbabweans | 100.0 /100 | #10 | Exceptional 15.4% |
| Indonesians | 100.0 /100 | #11 | Exceptional 15.5% |
| Taiwanese | 100.0 /100 | #12 | Exceptional 15.5% |
| Immigrants | Burma/Myanmar | 100.0 /100 | #13 | Exceptional 15.6% |
| Immigrants | Zaire | 100.0 /100 | #14 | Exceptional 15.6% |
| Yugoslavians | 100.0 /100 | #15 | Exceptional 15.6% |
| Germans | 100.0 /100 | #16 | Exceptional 15.7% |
| Somalis | 100.0 /100 | #17 | Exceptional 15.7% |
| Thais | 100.0 /100 | #18 | Exceptional 15.7% |
| Swiss | 100.0 /100 | #19 | Exceptional 15.8% |
| Sudanese | 100.0 /100 | #20 | Exceptional 15.8% |