Immigrants from Laos vs Choctaw Unemployment Among Ages 35 to 44 years
COMPARE
Immigrants from Laos
Choctaw
Unemployment Among Ages 35 to 44 years
Unemployment Among Ages 35 to 44 years Comparison
Immigrants from Laos
Choctaw
4.7%
UNEMPLOYMENT AMONG AGES 35 TO 44 YEARS
34.5/ 100
METRIC RATING
188th/ 347
METRIC RANK
5.3%
UNEMPLOYMENT AMONG AGES 35 TO 44 YEARS
0.1/ 100
METRIC RATING
263rd/ 347
METRIC RANK
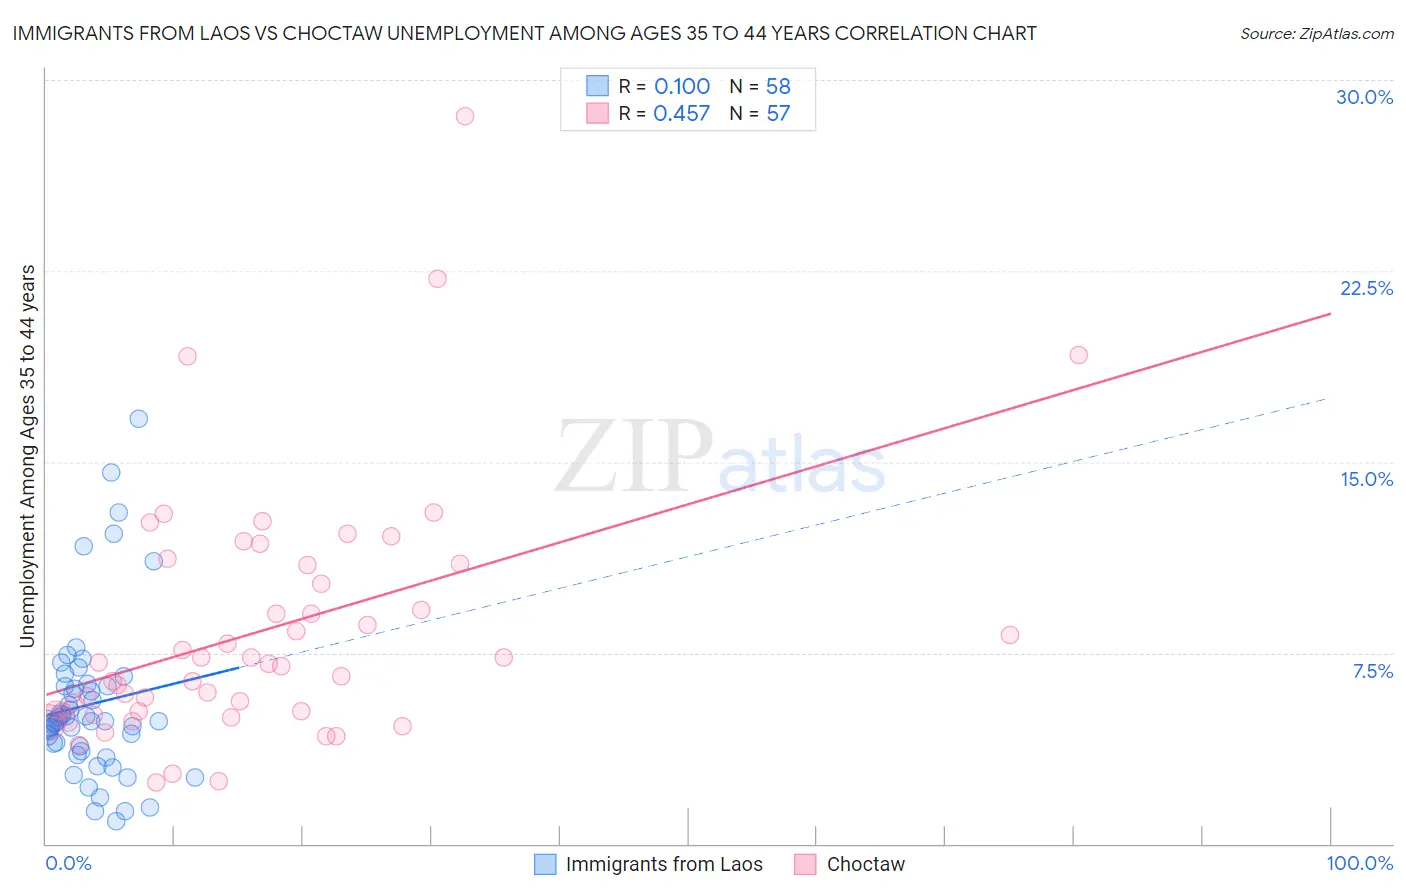
Immigrants from Laos vs Choctaw Unemployment Among Ages 35 to 44 years Correlation Chart
The statistical analysis conducted on geographies consisting of 199,441,542 people shows a slight positive correlation between the proportion of Immigrants from Laos and unemployment rate among population between the ages 35 and 44 in the United States with a correlation coefficient (R) of 0.100 and weighted average of 4.7%. Similarly, the statistical analysis conducted on geographies consisting of 264,238,381 people shows a moderate positive correlation between the proportion of Choctaw and unemployment rate among population between the ages 35 and 44 in the United States with a correlation coefficient (R) of 0.457 and weighted average of 5.3%, a difference of 11.9%.
Unemployment Among Ages 35 to 44 years Correlation Summary
| Measurement | Immigrants from Laos | Choctaw |
| Minimum | 0.90% | 2.4% |
| Maximum | 16.7% | 28.6% |
| Range | 15.8% | 26.2% |
| Mean | 5.5% | 8.4% |
| Median | 4.8% | 7.1% |
| Interquartile 25% (IQ1) | 3.8% | 5.2% |
| Interquartile 75% (IQ3) | 6.2% | 11.0% |
| Interquartile Range (IQR) | 2.4% | 5.8% |
| Standard Deviation (Sample) | 3.2% | 4.9% |
| Standard Deviation (Population) | 3.1% | 4.9% |
Similar Demographics by Unemployment Among Ages 35 to 44 years
Demographics Similar to Immigrants from Laos by Unemployment Among Ages 35 to 44 years
In terms of unemployment among ages 35 to 44 years, the demographic groups most similar to Immigrants from Laos are Immigrants from Congo (4.7%, a difference of 0.040%), Immigrants from Southern Europe (4.7%, a difference of 0.050%), Immigrants from South America (4.7%, a difference of 0.050%), Malaysian (4.7%, a difference of 0.080%), and Cypriot (4.7%, a difference of 0.15%).
| Demographics | Rating | Rank | Unemployment Among Ages 35 to 44 years |
| Brazilians | 39.5 /100 | #181 | Fair 4.7% |
| Israelis | 38.5 /100 | #182 | Fair 4.7% |
| Immigrants | Poland | 37.9 /100 | #183 | Fair 4.7% |
| Immigrants | Zaire | 37.3 /100 | #184 | Fair 4.7% |
| Immigrants | Costa Rica | 37.0 /100 | #185 | Fair 4.7% |
| Cypriots | 36.5 /100 | #186 | Fair 4.7% |
| Malaysians | 35.5 /100 | #187 | Fair 4.7% |
| Immigrants | Laos | 34.5 /100 | #188 | Fair 4.7% |
| Immigrants | Congo | 33.9 /100 | #189 | Fair 4.7% |
| Immigrants | Southern Europe | 33.8 /100 | #190 | Fair 4.7% |
| Immigrants | South America | 33.8 /100 | #191 | Fair 4.7% |
| Immigrants | Albania | 30.5 /100 | #192 | Fair 4.8% |
| Spanish | 30.4 /100 | #193 | Fair 4.8% |
| Koreans | 28.1 /100 | #194 | Fair 4.8% |
| Bangladeshis | 28.0 /100 | #195 | Fair 4.8% |
Demographics Similar to Choctaw by Unemployment Among Ages 35 to 44 years
In terms of unemployment among ages 35 to 44 years, the demographic groups most similar to Choctaw are Ghanaian (5.3%, a difference of 0.0%), Immigrants from Central America (5.3%, a difference of 0.070%), Yaqui (5.3%, a difference of 0.20%), Immigrants from Bangladesh (5.3%, a difference of 0.21%), and Immigrants from Western Africa (5.3%, a difference of 0.34%).
| Demographics | Rating | Rank | Unemployment Among Ages 35 to 44 years |
| Seminole | 0.1 /100 | #256 | Tragic 5.2% |
| Immigrants | Fiji | 0.1 /100 | #257 | Tragic 5.3% |
| Immigrants | Latin America | 0.1 /100 | #258 | Tragic 5.3% |
| Mexicans | 0.1 /100 | #259 | Tragic 5.3% |
| Sub-Saharan Africans | 0.1 /100 | #260 | Tragic 5.3% |
| Spanish Americans | 0.1 /100 | #261 | Tragic 5.3% |
| Immigrants | Central America | 0.1 /100 | #262 | Tragic 5.3% |
| Choctaw | 0.1 /100 | #263 | Tragic 5.3% |
| Ghanaians | 0.1 /100 | #264 | Tragic 5.3% |
| Yaqui | 0.1 /100 | #265 | Tragic 5.3% |
| Immigrants | Bangladesh | 0.1 /100 | #266 | Tragic 5.3% |
| Immigrants | Western Africa | 0.0 /100 | #267 | Tragic 5.3% |
| Hawaiians | 0.0 /100 | #268 | Tragic 5.3% |
| Cajuns | 0.0 /100 | #269 | Tragic 5.3% |
| Blackfeet | 0.0 /100 | #270 | Tragic 5.3% |