Immigrants from Korea vs Yaqui Unemployment Among Ages 55 to 59 years
COMPARE
Immigrants from Korea
Yaqui
Unemployment Among Ages 55 to 59 years
Unemployment Among Ages 55 to 59 years Comparison
Immigrants from Korea
Yaqui
4.5%
UNEMPLOYMENT AMONG AGES 55 TO 59 YEARS
99.8/ 100
METRIC RATING
43rd/ 347
METRIC RANK
5.2%
UNEMPLOYMENT AMONG AGES 55 TO 59 YEARS
0.1/ 100
METRIC RATING
265th/ 347
METRIC RANK
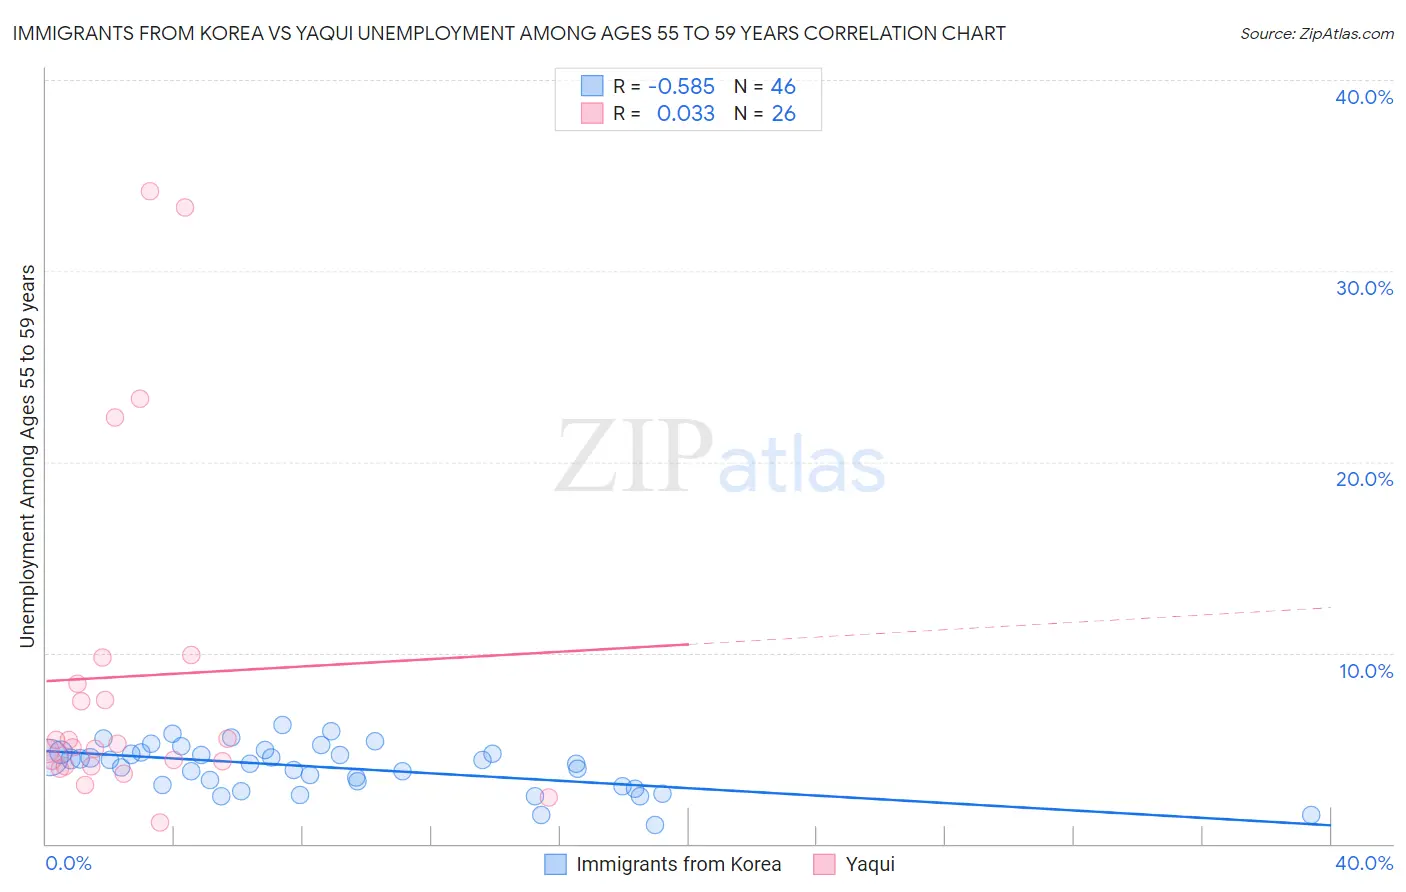
Immigrants from Korea vs Yaqui Unemployment Among Ages 55 to 59 years Correlation Chart
The statistical analysis conducted on geographies consisting of 385,536,412 people shows a substantial negative correlation between the proportion of Immigrants from Korea and unemployment rate among population between the ages 55 and 59 in the United States with a correlation coefficient (R) of -0.585 and weighted average of 4.5%. Similarly, the statistical analysis conducted on geographies consisting of 105,143,930 people shows no correlation between the proportion of Yaqui and unemployment rate among population between the ages 55 and 59 in the United States with a correlation coefficient (R) of 0.033 and weighted average of 5.2%, a difference of 14.3%.
Unemployment Among Ages 55 to 59 years Correlation Summary
| Measurement | Immigrants from Korea | Yaqui |
| Minimum | 1.0% | 1.1% |
| Maximum | 6.2% | 34.2% |
| Range | 5.2% | 33.1% |
| Mean | 4.0% | 8.8% |
| Median | 4.3% | 5.1% |
| Interquartile 25% (IQ1) | 3.1% | 4.1% |
| Interquartile 75% (IQ3) | 4.8% | 8.4% |
| Interquartile Range (IQR) | 1.7% | 4.3% |
| Standard Deviation (Sample) | 1.2% | 9.0% |
| Standard Deviation (Population) | 1.2% | 8.8% |
Similar Demographics by Unemployment Among Ages 55 to 59 years
Demographics Similar to Immigrants from Korea by Unemployment Among Ages 55 to 59 years
In terms of unemployment among ages 55 to 59 years, the demographic groups most similar to Immigrants from Korea are European (4.5%, a difference of 0.0%), Immigrants from Kuwait (4.5%, a difference of 0.040%), Luxembourger (4.5%, a difference of 0.060%), Swiss (4.5%, a difference of 0.070%), and British (4.5%, a difference of 0.070%).
| Demographics | Rating | Rank | Unemployment Among Ages 55 to 59 years |
| Ethiopians | 99.9 /100 | #36 | Exceptional 4.5% |
| Immigrants | Bulgaria | 99.9 /100 | #37 | Exceptional 4.5% |
| Assyrians/Chaldeans/Syriacs | 99.9 /100 | #38 | Exceptional 4.5% |
| English | 99.9 /100 | #39 | Exceptional 4.5% |
| Swiss | 99.8 /100 | #40 | Exceptional 4.5% |
| Luxembourgers | 99.8 /100 | #41 | Exceptional 4.5% |
| Immigrants | Kuwait | 99.8 /100 | #42 | Exceptional 4.5% |
| Immigrants | Korea | 99.8 /100 | #43 | Exceptional 4.5% |
| Europeans | 99.8 /100 | #44 | Exceptional 4.5% |
| British | 99.8 /100 | #45 | Exceptional 4.5% |
| Immigrants | Zaire | 99.8 /100 | #46 | Exceptional 4.5% |
| German Russians | 99.8 /100 | #47 | Exceptional 4.5% |
| Immigrants | Moldova | 99.7 /100 | #48 | Exceptional 4.5% |
| Immigrants | Saudi Arabia | 99.7 /100 | #49 | Exceptional 4.5% |
| Immigrants | Pakistan | 99.7 /100 | #50 | Exceptional 4.5% |
Demographics Similar to Yaqui by Unemployment Among Ages 55 to 59 years
In terms of unemployment among ages 55 to 59 years, the demographic groups most similar to Yaqui are Jamaican (5.2%, a difference of 0.030%), Immigrants from Senegal (5.2%, a difference of 0.030%), Mexican (5.2%, a difference of 0.040%), Immigrants from Caribbean (5.2%, a difference of 0.060%), and Tsimshian (5.2%, a difference of 0.060%).
| Demographics | Rating | Rank | Unemployment Among Ages 55 to 59 years |
| Salvadorans | 0.2 /100 | #258 | Tragic 5.1% |
| Immigrants | West Indies | 0.2 /100 | #259 | Tragic 5.1% |
| Immigrants | Western Africa | 0.2 /100 | #260 | Tragic 5.1% |
| Africans | 0.1 /100 | #261 | Tragic 5.1% |
| Immigrants | El Salvador | 0.1 /100 | #262 | Tragic 5.1% |
| Immigrants | Sierra Leone | 0.1 /100 | #263 | Tragic 5.2% |
| Immigrants | Caribbean | 0.1 /100 | #264 | Tragic 5.2% |
| Yaqui | 0.1 /100 | #265 | Tragic 5.2% |
| Jamaicans | 0.1 /100 | #266 | Tragic 5.2% |
| Immigrants | Senegal | 0.1 /100 | #267 | Tragic 5.2% |
| Mexicans | 0.1 /100 | #268 | Tragic 5.2% |
| Tsimshian | 0.1 /100 | #269 | Tragic 5.2% |
| Ute | 0.1 /100 | #270 | Tragic 5.2% |
| Cree | 0.1 /100 | #271 | Tragic 5.2% |
| Immigrants | Jamaica | 0.0 /100 | #272 | Tragic 5.2% |