Immigrants from Korea vs Mongolian Unemployment Among Seniors over 75 years
COMPARE
Immigrants from Korea
Mongolian
Unemployment Among Seniors over 75 years
Unemployment Among Seniors over 75 years Comparison
Immigrants from Korea
Mongolians
8.1%
UNEMPLOYMENT AMONG SENIORS OVER 75 YEARS
99.5/ 100
METRIC RATING
89th/ 347
METRIC RANK
8.6%
UNEMPLOYMENT AMONG SENIORS OVER 75 YEARS
80.1/ 100
METRIC RATING
153rd/ 347
METRIC RANK
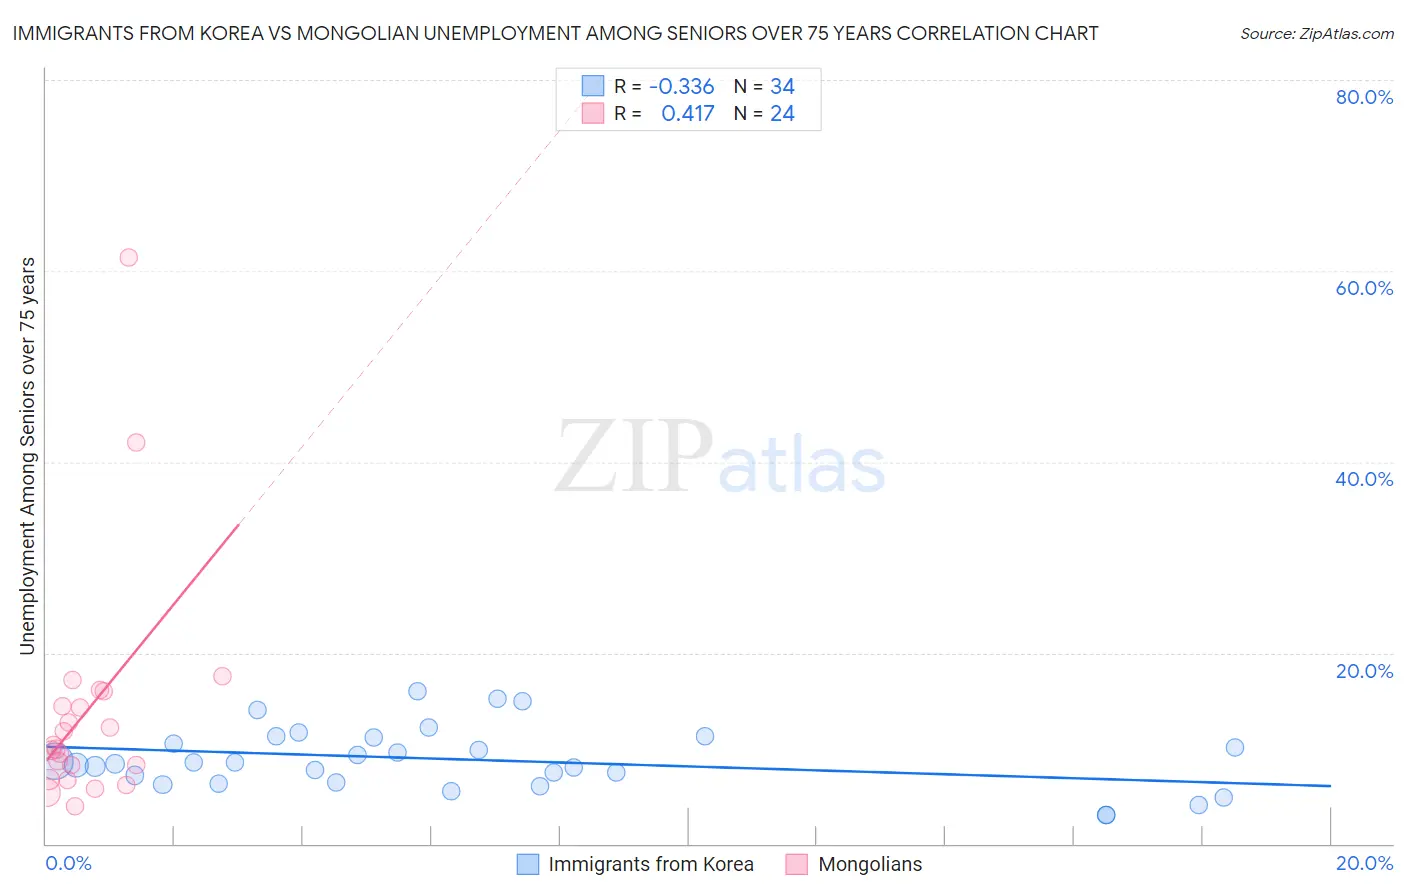
Immigrants from Korea vs Mongolian Unemployment Among Seniors over 75 years Correlation Chart
The statistical analysis conducted on geographies consisting of 206,994,306 people shows a mild negative correlation between the proportion of Immigrants from Korea and unemployment rate among seniors over the age of 75 in the United States with a correlation coefficient (R) of -0.336 and weighted average of 8.1%. Similarly, the statistical analysis conducted on geographies consisting of 100,305,520 people shows a moderate positive correlation between the proportion of Mongolians and unemployment rate among seniors over the age of 75 in the United States with a correlation coefficient (R) of 0.417 and weighted average of 8.6%, a difference of 5.7%.
Unemployment Among Seniors over 75 years Correlation Summary
| Measurement | Immigrants from Korea | Mongolian |
| Minimum | 3.0% | 3.9% |
| Maximum | 16.0% | 61.4% |
| Range | 13.0% | 57.5% |
| Mean | 8.8% | 14.0% |
| Median | 8.4% | 10.1% |
| Interquartile 25% (IQ1) | 6.4% | 7.5% |
| Interquartile 75% (IQ3) | 11.2% | 15.2% |
| Interquartile Range (IQR) | 4.8% | 7.8% |
| Standard Deviation (Sample) | 3.3% | 12.6% |
| Standard Deviation (Population) | 3.2% | 12.3% |
Similar Demographics by Unemployment Among Seniors over 75 years
Demographics Similar to Immigrants from Korea by Unemployment Among Seniors over 75 years
In terms of unemployment among seniors over 75 years, the demographic groups most similar to Immigrants from Korea are New Zealander (8.1%, a difference of 0.010%), Basque (8.1%, a difference of 0.050%), Immigrants from Vietnam (8.1%, a difference of 0.080%), Egyptian (8.1%, a difference of 0.12%), and Venezuelan (8.1%, a difference of 0.12%).
| Demographics | Rating | Rank | Unemployment Among Seniors over 75 years |
| Bhutanese | 99.7 /100 | #82 | Exceptional 8.0% |
| Arapaho | 99.7 /100 | #83 | Exceptional 8.1% |
| U.S. Virgin Islanders | 99.7 /100 | #84 | Exceptional 8.1% |
| Immigrants | Indonesia | 99.7 /100 | #85 | Exceptional 8.1% |
| Immigrants | Singapore | 99.7 /100 | #86 | Exceptional 8.1% |
| Basques | 99.5 /100 | #87 | Exceptional 8.1% |
| New Zealanders | 99.5 /100 | #88 | Exceptional 8.1% |
| Immigrants | Korea | 99.5 /100 | #89 | Exceptional 8.1% |
| Immigrants | Vietnam | 99.5 /100 | #90 | Exceptional 8.1% |
| Egyptians | 99.5 /100 | #91 | Exceptional 8.1% |
| Venezuelans | 99.5 /100 | #92 | Exceptional 8.1% |
| Immigrants | Netherlands | 99.5 /100 | #93 | Exceptional 8.1% |
| Immigrants | Ireland | 99.4 /100 | #94 | Exceptional 8.1% |
| Nicaraguans | 99.3 /100 | #95 | Exceptional 8.2% |
| Immigrants | Belgium | 99.3 /100 | #96 | Exceptional 8.2% |
Demographics Similar to Mongolians by Unemployment Among Seniors over 75 years
In terms of unemployment among seniors over 75 years, the demographic groups most similar to Mongolians are Immigrants from Bosnia and Herzegovina (8.6%, a difference of 0.040%), Latvian (8.6%, a difference of 0.040%), Immigrants from Pakistan (8.6%, a difference of 0.040%), Ecuadorian (8.6%, a difference of 0.13%), and Paiute (8.6%, a difference of 0.21%).
| Demographics | Rating | Rank | Unemployment Among Seniors over 75 years |
| Immigrants | South Eastern Asia | 85.8 /100 | #146 | Excellent 8.5% |
| Immigrants | Sierra Leone | 85.6 /100 | #147 | Excellent 8.5% |
| Immigrants | Colombia | 85.6 /100 | #148 | Excellent 8.5% |
| Immigrants | Ecuador | 84.6 /100 | #149 | Excellent 8.5% |
| Paiute | 82.5 /100 | #150 | Excellent 8.6% |
| Immigrants | Bosnia and Herzegovina | 80.6 /100 | #151 | Excellent 8.6% |
| Latvians | 80.5 /100 | #152 | Excellent 8.6% |
| Mongolians | 80.1 /100 | #153 | Excellent 8.6% |
| Immigrants | Pakistan | 79.7 /100 | #154 | Good 8.6% |
| Ecuadorians | 78.5 /100 | #155 | Good 8.6% |
| Immigrants | Bahamas | 76.5 /100 | #156 | Good 8.6% |
| Turks | 76.4 /100 | #157 | Good 8.6% |
| Ethiopians | 75.3 /100 | #158 | Good 8.6% |
| Shoshone | 74.6 /100 | #159 | Good 8.6% |
| Cree | 72.8 /100 | #160 | Good 8.6% |