Immigrants from Korea vs Immigrants from Switzerland Unemployment Among Ages 60 to 64 years
COMPARE
Immigrants from Korea
Immigrants from Switzerland
Unemployment Among Ages 60 to 64 years
Unemployment Among Ages 60 to 64 years Comparison
Immigrants from Korea
Immigrants from Switzerland
4.8%
UNEMPLOYMENT AMONG AGES 60 TO 64 YEARS
54.2/ 100
METRIC RATING
170th/ 347
METRIC RANK
5.1%
UNEMPLOYMENT AMONG AGES 60 TO 64 YEARS
0.9/ 100
METRIC RATING
252nd/ 347
METRIC RANK
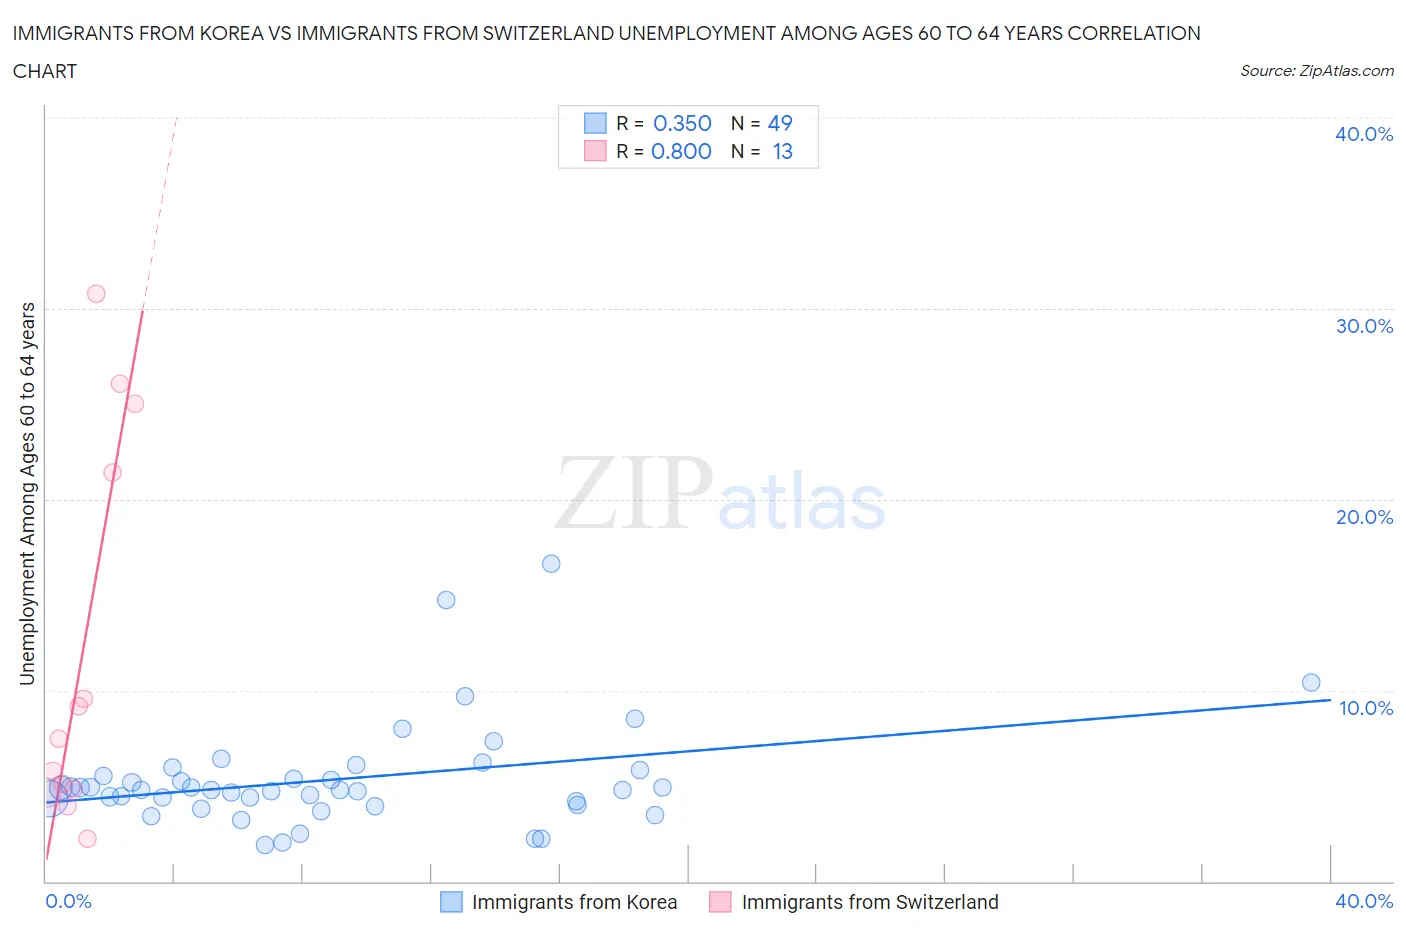
Immigrants from Korea vs Immigrants from Switzerland Unemployment Among Ages 60 to 64 years Correlation Chart
The statistical analysis conducted on geographies consisting of 374,603,852 people shows a mild positive correlation between the proportion of Immigrants from Korea and unemployment rate among population between the ages 60 and 64 in the United States with a correlation coefficient (R) of 0.350 and weighted average of 4.8%. Similarly, the statistical analysis conducted on geographies consisting of 142,143,015 people shows a strong positive correlation between the proportion of Immigrants from Switzerland and unemployment rate among population between the ages 60 and 64 in the United States with a correlation coefficient (R) of 0.800 and weighted average of 5.1%, a difference of 4.3%.
Unemployment Among Ages 60 to 64 years Correlation Summary
| Measurement | Immigrants from Korea | Immigrants from Switzerland |
| Minimum | 1.9% | 2.2% |
| Maximum | 16.6% | 30.8% |
| Range | 14.7% | 28.6% |
| Mean | 5.3% | 12.0% |
| Median | 4.8% | 7.4% |
| Interquartile 25% (IQ1) | 4.1% | 4.8% |
| Interquartile 75% (IQ3) | 5.7% | 23.2% |
| Interquartile Range (IQR) | 1.6% | 18.4% |
| Standard Deviation (Sample) | 2.8% | 10.0% |
| Standard Deviation (Population) | 2.7% | 9.6% |
Similar Demographics by Unemployment Among Ages 60 to 64 years
Demographics Similar to Immigrants from Korea by Unemployment Among Ages 60 to 64 years
In terms of unemployment among ages 60 to 64 years, the demographic groups most similar to Immigrants from Korea are Samoan (4.9%, a difference of 0.020%), Immigrants from France (4.8%, a difference of 0.050%), Immigrants from Turkey (4.9%, a difference of 0.050%), Immigrants from Southern Europe (4.8%, a difference of 0.090%), and Immigrants from Hungary (4.9%, a difference of 0.14%).
| Demographics | Rating | Rank | Unemployment Among Ages 60 to 64 years |
| Immigrants | Belgium | 64.8 /100 | #163 | Good 4.8% |
| Pakistanis | 64.6 /100 | #164 | Good 4.8% |
| Immigrants | Panama | 62.0 /100 | #165 | Good 4.8% |
| Palestinians | 60.5 /100 | #166 | Good 4.8% |
| Immigrants | Northern Europe | 59.1 /100 | #167 | Average 4.8% |
| Immigrants | Southern Europe | 56.7 /100 | #168 | Average 4.8% |
| Immigrants | France | 55.5 /100 | #169 | Average 4.8% |
| Immigrants | Korea | 54.2 /100 | #170 | Average 4.8% |
| Samoans | 53.6 /100 | #171 | Average 4.9% |
| Immigrants | Turkey | 52.8 /100 | #172 | Average 4.9% |
| Immigrants | Hungary | 50.2 /100 | #173 | Average 4.9% |
| Immigrants | Western Europe | 50.0 /100 | #174 | Average 4.9% |
| Immigrants | Latvia | 46.9 /100 | #175 | Average 4.9% |
| Bermudans | 46.5 /100 | #176 | Average 4.9% |
| Immigrants | Malaysia | 44.7 /100 | #177 | Average 4.9% |
Demographics Similar to Immigrants from Switzerland by Unemployment Among Ages 60 to 64 years
In terms of unemployment among ages 60 to 64 years, the demographic groups most similar to Immigrants from Switzerland are Immigrants from Uruguay (5.1%, a difference of 0.010%), Immigrants from China (5.1%, a difference of 0.040%), Immigrants from Cambodia (5.1%, a difference of 0.050%), Costa Rican (5.1%, a difference of 0.070%), and Estonian (5.1%, a difference of 0.080%).
| Demographics | Rating | Rank | Unemployment Among Ages 60 to 64 years |
| Comanche | 1.3 /100 | #245 | Tragic 5.0% |
| Immigrants | South America | 1.1 /100 | #246 | Tragic 5.0% |
| Immigrants | North Macedonia | 1.1 /100 | #247 | Tragic 5.0% |
| Immigrants | Fiji | 1.1 /100 | #248 | Tragic 5.1% |
| South Americans | 1.0 /100 | #249 | Tragic 5.1% |
| Immigrants | Cambodia | 0.9 /100 | #250 | Tragic 5.1% |
| Immigrants | Uruguay | 0.9 /100 | #251 | Tragic 5.1% |
| Immigrants | Switzerland | 0.9 /100 | #252 | Tragic 5.1% |
| Immigrants | China | 0.9 /100 | #253 | Tragic 5.1% |
| Costa Ricans | 0.8 /100 | #254 | Tragic 5.1% |
| Estonians | 0.8 /100 | #255 | Tragic 5.1% |
| Immigrants | Peru | 0.7 /100 | #256 | Tragic 5.1% |
| Japanese | 0.6 /100 | #257 | Tragic 5.1% |
| Celtics | 0.5 /100 | #258 | Tragic 5.1% |
| Hondurans | 0.5 /100 | #259 | Tragic 5.1% |