Immigrants from Kenya vs Immigrants from Kuwait Unemployment Among Ages 60 to 64 years
COMPARE
Immigrants from Kenya
Immigrants from Kuwait
Unemployment Among Ages 60 to 64 years
Unemployment Among Ages 60 to 64 years Comparison
Immigrants from Kenya
Immigrants from Kuwait
4.6%
UNEMPLOYMENT AMONG AGES 60 TO 64 YEARS
99.9/ 100
METRIC RATING
51st/ 347
METRIC RANK
4.7%
UNEMPLOYMENT AMONG AGES 60 TO 64 YEARS
98.3/ 100
METRIC RATING
94th/ 347
METRIC RANK
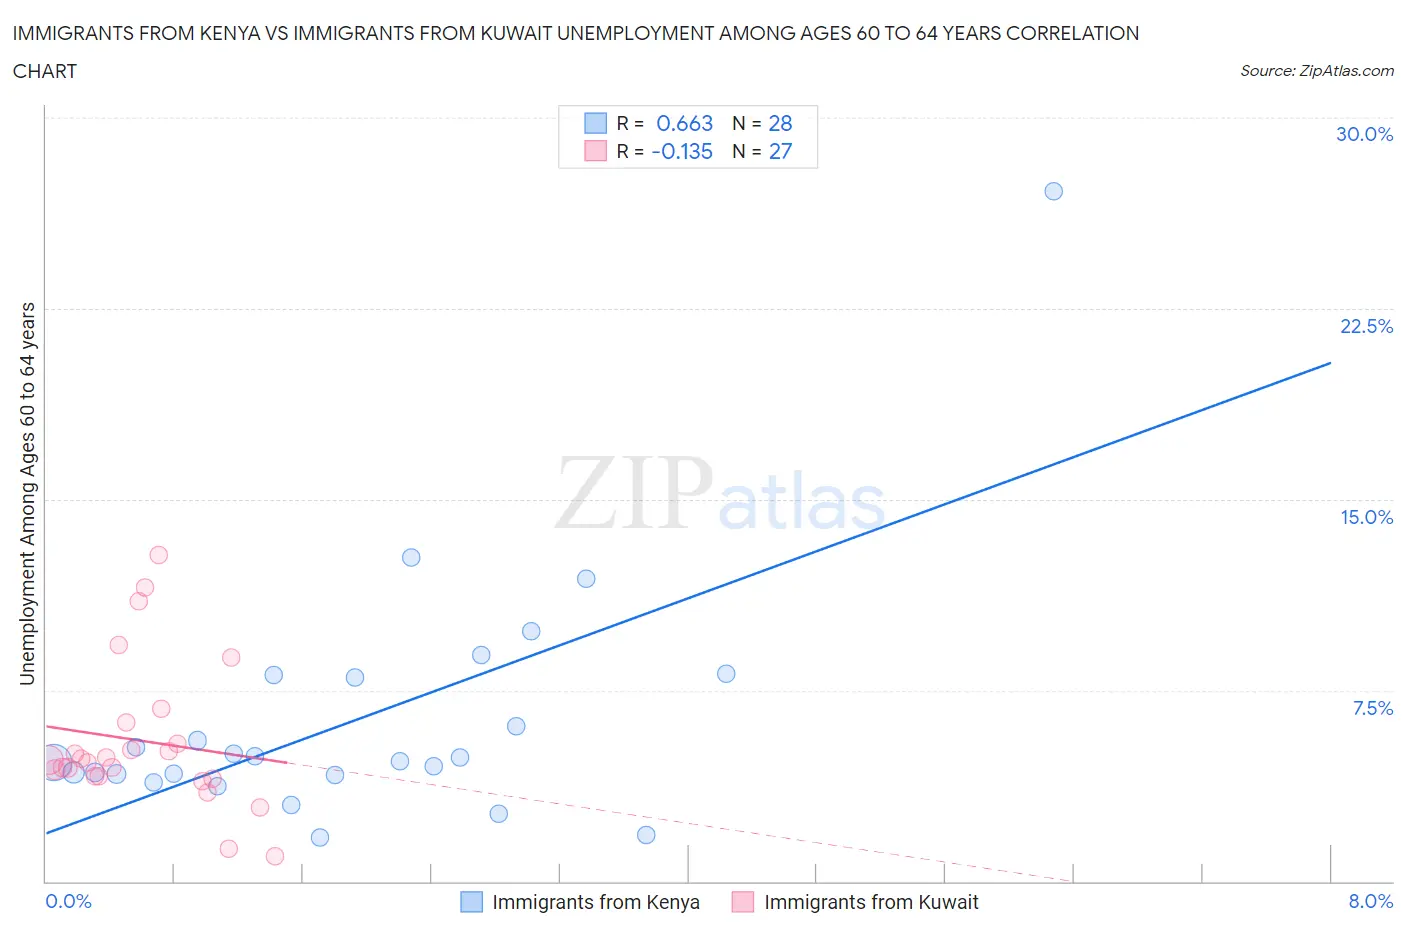
Immigrants from Kenya vs Immigrants from Kuwait Unemployment Among Ages 60 to 64 years Correlation Chart
The statistical analysis conducted on geographies consisting of 206,328,439 people shows a significant positive correlation between the proportion of Immigrants from Kenya and unemployment rate among population between the ages 60 and 64 in the United States with a correlation coefficient (R) of 0.663 and weighted average of 4.6%. Similarly, the statistical analysis conducted on geographies consisting of 132,594,540 people shows a poor negative correlation between the proportion of Immigrants from Kuwait and unemployment rate among population between the ages 60 and 64 in the United States with a correlation coefficient (R) of -0.135 and weighted average of 4.7%, a difference of 2.6%.
Unemployment Among Ages 60 to 64 years Correlation Summary
| Measurement | Immigrants from Kenya | Immigrants from Kuwait |
| Minimum | 1.7% | 1.0% |
| Maximum | 27.1% | 12.8% |
| Range | 25.4% | 11.8% |
| Mean | 6.4% | 5.5% |
| Median | 4.8% | 4.8% |
| Interquartile 25% (IQ1) | 4.2% | 4.1% |
| Interquartile 75% (IQ3) | 8.1% | 6.2% |
| Interquartile Range (IQR) | 3.9% | 2.1% |
| Standard Deviation (Sample) | 4.9% | 2.9% |
| Standard Deviation (Population) | 4.8% | 2.8% |
Similar Demographics by Unemployment Among Ages 60 to 64 years
Demographics Similar to Immigrants from Kenya by Unemployment Among Ages 60 to 64 years
In terms of unemployment among ages 60 to 64 years, the demographic groups most similar to Immigrants from Kenya are Kenyan (4.6%, a difference of 0.010%), Scottish (4.6%, a difference of 0.11%), Immigrants from Moldova (4.6%, a difference of 0.12%), Scotch-Irish (4.6%, a difference of 0.15%), and Dutch (4.6%, a difference of 0.15%).
| Demographics | Rating | Rank | Unemployment Among Ages 60 to 64 years |
| Europeans | 100.0 /100 | #44 | Exceptional 4.5% |
| Liberians | 99.9 /100 | #45 | Exceptional 4.5% |
| Bhutanese | 99.9 /100 | #46 | Exceptional 4.5% |
| Assyrians/Chaldeans/Syriacs | 99.9 /100 | #47 | Exceptional 4.5% |
| Immigrants | Zimbabwe | 99.9 /100 | #48 | Exceptional 4.6% |
| Scotch-Irish | 99.9 /100 | #49 | Exceptional 4.6% |
| Scottish | 99.9 /100 | #50 | Exceptional 4.6% |
| Immigrants | Kenya | 99.9 /100 | #51 | Exceptional 4.6% |
| Kenyans | 99.9 /100 | #52 | Exceptional 4.6% |
| Immigrants | Moldova | 99.9 /100 | #53 | Exceptional 4.6% |
| Dutch | 99.9 /100 | #54 | Exceptional 4.6% |
| Bangladeshis | 99.9 /100 | #55 | Exceptional 4.6% |
| Welsh | 99.9 /100 | #56 | Exceptional 4.6% |
| British | 99.9 /100 | #57 | Exceptional 4.6% |
| Immigrants | India | 99.8 /100 | #58 | Exceptional 4.6% |
Demographics Similar to Immigrants from Kuwait by Unemployment Among Ages 60 to 64 years
In terms of unemployment among ages 60 to 64 years, the demographic groups most similar to Immigrants from Kuwait are Immigrants from Saudi Arabia (4.7%, a difference of 0.010%), Romanian (4.7%, a difference of 0.030%), Immigrants from Uganda (4.7%, a difference of 0.060%), Serbian (4.7%, a difference of 0.080%), and Polish (4.7%, a difference of 0.090%).
| Demographics | Rating | Rank | Unemployment Among Ages 60 to 64 years |
| Immigrants | Jordan | 98.8 /100 | #87 | Exceptional 4.7% |
| Immigrants | Bulgaria | 98.7 /100 | #88 | Exceptional 4.7% |
| Immigrants | Northern Africa | 98.7 /100 | #89 | Exceptional 4.7% |
| Immigrants | Liberia | 98.7 /100 | #90 | Exceptional 4.7% |
| Immigrants | Uganda | 98.4 /100 | #91 | Exceptional 4.7% |
| Romanians | 98.4 /100 | #92 | Exceptional 4.7% |
| Immigrants | Saudi Arabia | 98.3 /100 | #93 | Exceptional 4.7% |
| Immigrants | Kuwait | 98.3 /100 | #94 | Exceptional 4.7% |
| Serbians | 98.2 /100 | #95 | Exceptional 4.7% |
| Poles | 98.1 /100 | #96 | Exceptional 4.7% |
| Immigrants | Albania | 98.0 /100 | #97 | Exceptional 4.7% |
| Somalis | 98.0 /100 | #98 | Exceptional 4.7% |
| Egyptians | 98.0 /100 | #99 | Exceptional 4.7% |
| Portuguese | 97.9 /100 | #100 | Exceptional 4.7% |
| Malaysians | 97.9 /100 | #101 | Exceptional 4.7% |