Immigrants from Kenya vs Bolivian Unemployment Among Ages 65 to 74 years
COMPARE
Immigrants from Kenya
Bolivian
Unemployment Among Ages 65 to 74 years
Unemployment Among Ages 65 to 74 years Comparison
Immigrants from Kenya
Bolivians
5.1%
UNEMPLOYMENT AMONG AGES 65 TO 74 YEARS
99.8/ 100
METRIC RATING
46th/ 347
METRIC RANK
5.1%
UNEMPLOYMENT AMONG AGES 65 TO 74 YEARS
99.3/ 100
METRIC RATING
65th/ 347
METRIC RANK
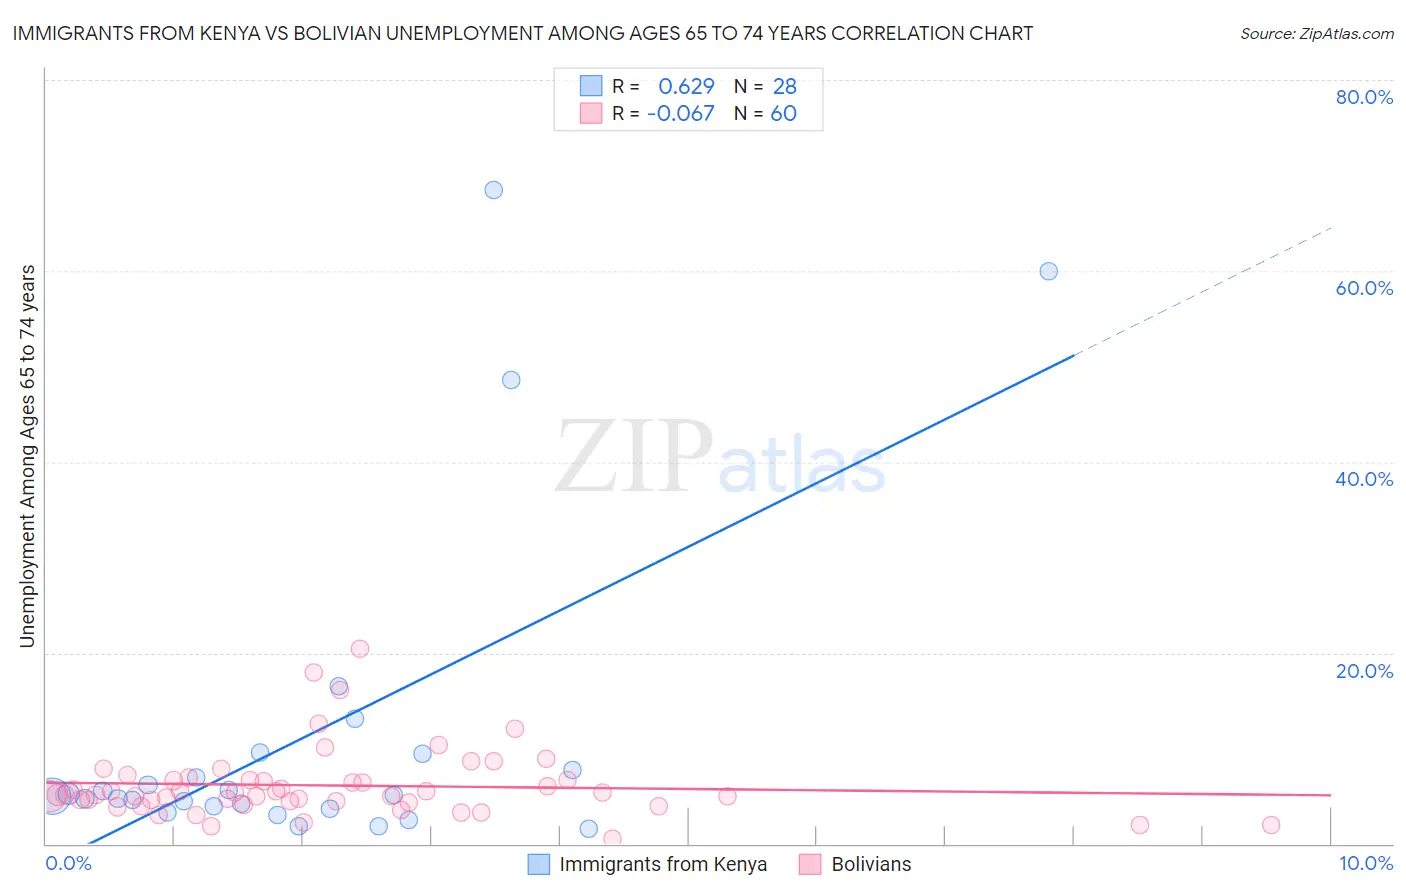
Immigrants from Kenya vs Bolivian Unemployment Among Ages 65 to 74 years Correlation Chart
The statistical analysis conducted on geographies consisting of 203,560,048 people shows a significant positive correlation between the proportion of Immigrants from Kenya and unemployment rate among population between the ages 65 and 74 in the United States with a correlation coefficient (R) of 0.629 and weighted average of 5.1%. Similarly, the statistical analysis conducted on geographies consisting of 173,380,065 people shows a slight negative correlation between the proportion of Bolivians and unemployment rate among population between the ages 65 and 74 in the United States with a correlation coefficient (R) of -0.067 and weighted average of 5.1%, a difference of 1.2%.
Unemployment Among Ages 65 to 74 years Correlation Summary
| Measurement | Immigrants from Kenya | Bolivian |
| Minimum | 1.6% | 0.50% |
| Maximum | 68.5% | 20.4% |
| Range | 66.9% | 19.9% |
| Mean | 11.3% | 6.1% |
| Median | 5.0% | 5.1% |
| Interquartile 25% (IQ1) | 3.8% | 4.4% |
| Interquartile 75% (IQ3) | 8.6% | 6.6% |
| Interquartile Range (IQR) | 4.7% | 2.3% |
| Standard Deviation (Sample) | 17.4% | 3.6% |
| Standard Deviation (Population) | 17.0% | 3.6% |
Demographics Similar to Immigrants from Kenya and Bolivians by Unemployment Among Ages 65 to 74 years
In terms of unemployment among ages 65 to 74 years, the demographic groups most similar to Immigrants from Kenya are Immigrants from Uganda (5.1%, a difference of 0.050%), Sioux (5.1%, a difference of 0.14%), Choctaw (5.1%, a difference of 0.21%), Immigrants from Austria (5.1%, a difference of 0.22%), and Immigrants from Zimbabwe (5.1%, a difference of 0.39%). Similarly, the demographic groups most similar to Bolivians are Immigrants from Moldova (5.1%, a difference of 0.0%), Kiowa (5.1%, a difference of 0.060%), Nicaraguan (5.1%, a difference of 0.10%), Immigrants from Taiwan (5.1%, a difference of 0.11%), and Immigrants from Jordan (5.1%, a difference of 0.18%).
| Demographics | Rating | Rank | Unemployment Among Ages 65 to 74 years |
| Sioux | 99.8 /100 | #45 | Exceptional 5.1% |
| Immigrants | Kenya | 99.8 /100 | #46 | Exceptional 5.1% |
| Immigrants | Uganda | 99.8 /100 | #47 | Exceptional 5.1% |
| Choctaw | 99.8 /100 | #48 | Exceptional 5.1% |
| Immigrants | Austria | 99.8 /100 | #49 | Exceptional 5.1% |
| Immigrants | Zimbabwe | 99.7 /100 | #50 | Exceptional 5.1% |
| Immigrants | Kazakhstan | 99.7 /100 | #51 | Exceptional 5.1% |
| Europeans | 99.6 /100 | #52 | Exceptional 5.1% |
| Immigrants | Ethiopia | 99.6 /100 | #53 | Exceptional 5.1% |
| Immigrants | Nicaragua | 99.6 /100 | #54 | Exceptional 5.1% |
| Carpatho Rusyns | 99.6 /100 | #55 | Exceptional 5.1% |
| Swedes | 99.5 /100 | #56 | Exceptional 5.1% |
| Croatians | 99.5 /100 | #57 | Exceptional 5.1% |
| Germans | 99.5 /100 | #58 | Exceptional 5.1% |
| Immigrants | Bulgaria | 99.4 /100 | #59 | Exceptional 5.1% |
| Immigrants | Jordan | 99.4 /100 | #60 | Exceptional 5.1% |
| Immigrants | Taiwan | 99.4 /100 | #61 | Exceptional 5.1% |
| Nicaraguans | 99.4 /100 | #62 | Exceptional 5.1% |
| Kiowa | 99.3 /100 | #63 | Exceptional 5.1% |
| Immigrants | Moldova | 99.3 /100 | #64 | Exceptional 5.1% |
| Bolivians | 99.3 /100 | #65 | Exceptional 5.1% |