Immigrants from Japan vs Immigrants from Asia Unemployment Among Youth under 25 years
COMPARE
Immigrants from Japan
Immigrants from Asia
Unemployment Among Youth under 25 years
Unemployment Among Youth under 25 years Comparison
Immigrants from Japan
Immigrants from Asia
11.2%
UNEMPLOYMENT AMONG YOUTH UNDER 25 YEARS
95.5/ 100
METRIC RATING
89th/ 347
METRIC RANK
11.5%
UNEMPLOYMENT AMONG YOUTH UNDER 25 YEARS
66.7/ 100
METRIC RATING
154th/ 347
METRIC RANK
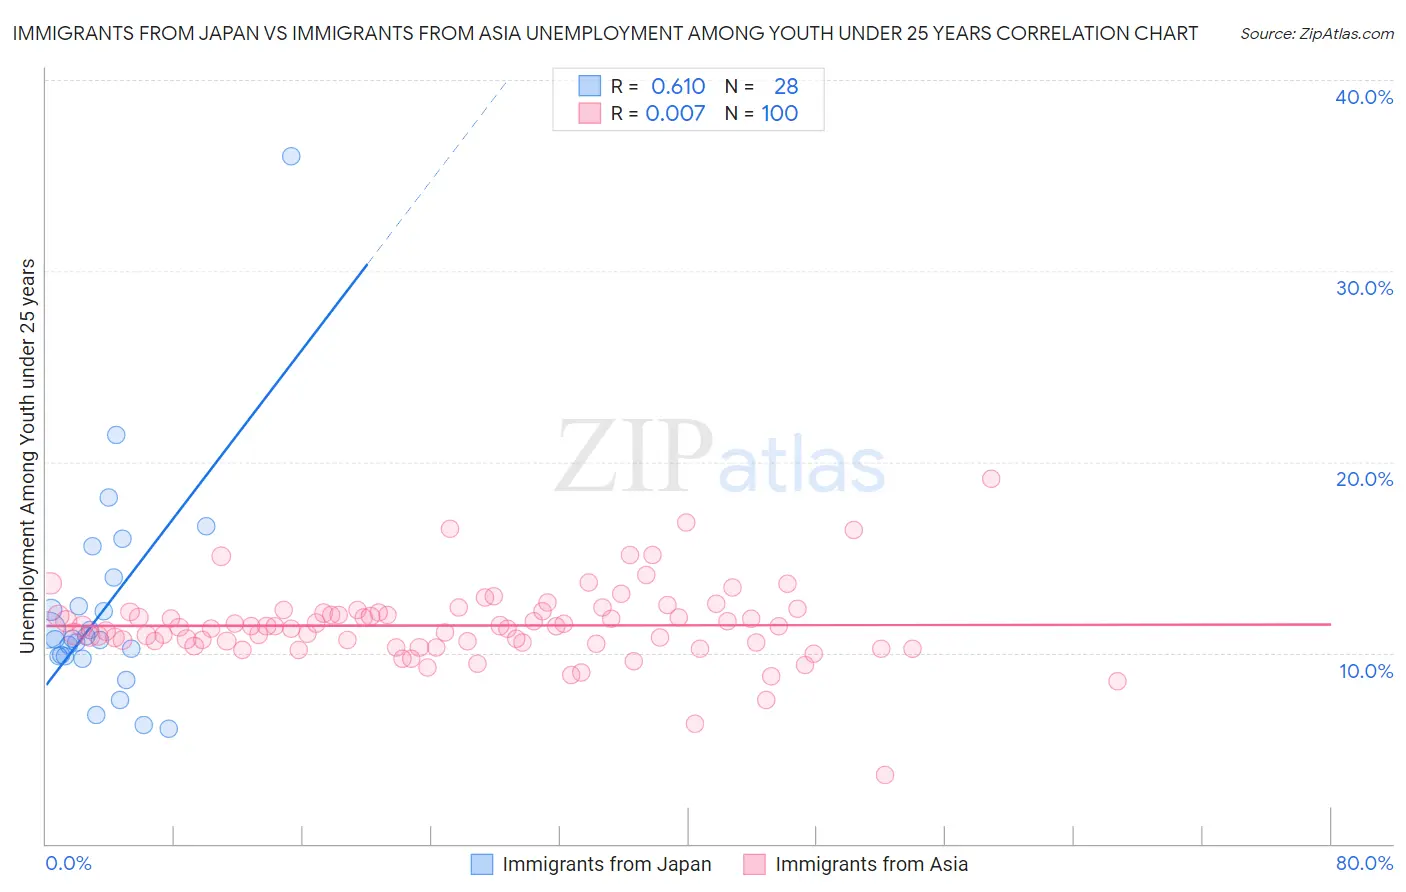
Immigrants from Japan vs Immigrants from Asia Unemployment Among Youth under 25 years Correlation Chart
The statistical analysis conducted on geographies consisting of 337,330,907 people shows a significant positive correlation between the proportion of Immigrants from Japan and unemployment rate among youth under the age of 25 in the United States with a correlation coefficient (R) of 0.610 and weighted average of 11.2%. Similarly, the statistical analysis conducted on geographies consisting of 532,232,122 people shows no correlation between the proportion of Immigrants from Asia and unemployment rate among youth under the age of 25 in the United States with a correlation coefficient (R) of 0.007 and weighted average of 11.5%, a difference of 2.5%.
Unemployment Among Youth under 25 years Correlation Summary
| Measurement | Immigrants from Japan | Immigrants from Asia |
| Minimum | 6.0% | 3.6% |
| Maximum | 36.0% | 19.1% |
| Range | 30.0% | 15.5% |
| Mean | 12.3% | 11.4% |
| Median | 10.7% | 11.4% |
| Interquartile 25% (IQ1) | 9.8% | 10.5% |
| Interquartile 75% (IQ3) | 13.2% | 12.1% |
| Interquartile Range (IQR) | 3.4% | 1.6% |
| Standard Deviation (Sample) | 5.8% | 2.0% |
| Standard Deviation (Population) | 5.7% | 2.0% |
Similar Demographics by Unemployment Among Youth under 25 years
Demographics Similar to Immigrants from Japan by Unemployment Among Youth under 25 years
In terms of unemployment among youth under 25 years, the demographic groups most similar to Immigrants from Japan are Austrian (11.2%, a difference of 0.0%), Immigrants from Bolivia (11.2%, a difference of 0.010%), Kenyan (11.2%, a difference of 0.060%), Immigrants from South Africa (11.2%, a difference of 0.070%), and Immigrants from Taiwan (11.2%, a difference of 0.090%).
| Demographics | Rating | Rank | Unemployment Among Youth under 25 years |
| Northern Europeans | 96.2 /100 | #82 | Exceptional 11.2% |
| Bolivians | 96.1 /100 | #83 | Exceptional 11.2% |
| French Canadians | 95.9 /100 | #84 | Exceptional 11.2% |
| Immigrants | South Central Asia | 95.9 /100 | #85 | Exceptional 11.2% |
| Immigrants | South Africa | 95.8 /100 | #86 | Exceptional 11.2% |
| Kenyans | 95.7 /100 | #87 | Exceptional 11.2% |
| Austrians | 95.5 /100 | #88 | Exceptional 11.2% |
| Immigrants | Japan | 95.5 /100 | #89 | Exceptional 11.2% |
| Immigrants | Bolivia | 95.5 /100 | #90 | Exceptional 11.2% |
| Immigrants | Taiwan | 95.1 /100 | #91 | Exceptional 11.2% |
| Immigrants | Latvia | 95.1 /100 | #92 | Exceptional 11.2% |
| Immigrants | North America | 95.1 /100 | #93 | Exceptional 11.2% |
| Lithuanians | 94.8 /100 | #94 | Exceptional 11.3% |
| Carpatho Rusyns | 94.4 /100 | #95 | Exceptional 11.3% |
| Immigrants | Serbia | 94.4 /100 | #96 | Exceptional 11.3% |
Demographics Similar to Immigrants from Asia by Unemployment Among Youth under 25 years
In terms of unemployment among youth under 25 years, the demographic groups most similar to Immigrants from Asia are Immigrants from Czechoslovakia (11.5%, a difference of 0.020%), Immigrants from Romania (11.5%, a difference of 0.020%), Immigrants from Germany (11.5%, a difference of 0.040%), Iraqi (11.5%, a difference of 0.070%), and Indian (Asian) (11.5%, a difference of 0.070%).
| Demographics | Rating | Rank | Unemployment Among Youth under 25 years |
| Laotians | 72.4 /100 | #147 | Good 11.5% |
| Immigrants | Northern Europe | 72.1 /100 | #148 | Good 11.5% |
| Immigrants | Cambodia | 71.8 /100 | #149 | Good 11.5% |
| Immigrants | Switzerland | 71.6 /100 | #150 | Good 11.5% |
| Uruguayans | 70.4 /100 | #151 | Good 11.5% |
| Iraqis | 68.3 /100 | #152 | Good 11.5% |
| Immigrants | Czechoslovakia | 67.1 /100 | #153 | Good 11.5% |
| Immigrants | Asia | 66.7 /100 | #154 | Good 11.5% |
| Immigrants | Romania | 66.3 /100 | #155 | Good 11.5% |
| Immigrants | Germany | 65.9 /100 | #156 | Good 11.5% |
| Indians (Asian) | 65.1 /100 | #157 | Good 11.5% |
| Immigrants | Turkey | 64.8 /100 | #158 | Good 11.5% |
| Immigrants | Western Europe | 64.7 /100 | #159 | Good 11.5% |
| Immigrants | Eastern Asia | 64.5 /100 | #160 | Good 11.5% |
| Ukrainians | 64.3 /100 | #161 | Good 11.5% |