Immigrants from Japan vs Guyanese Unemployment Among Ages 30 to 34 years
COMPARE
Immigrants from Japan
Guyanese
Unemployment Among Ages 30 to 34 years
Unemployment Among Ages 30 to 34 years Comparison
Immigrants from Japan
Guyanese
5.1%
UNEMPLOYMENT AMONG AGES 30 TO 34 YEARS
96.8/ 100
METRIC RATING
65th/ 347
METRIC RANK
7.2%
UNEMPLOYMENT AMONG AGES 30 TO 34 YEARS
0.0/ 100
METRIC RATING
319th/ 347
METRIC RANK
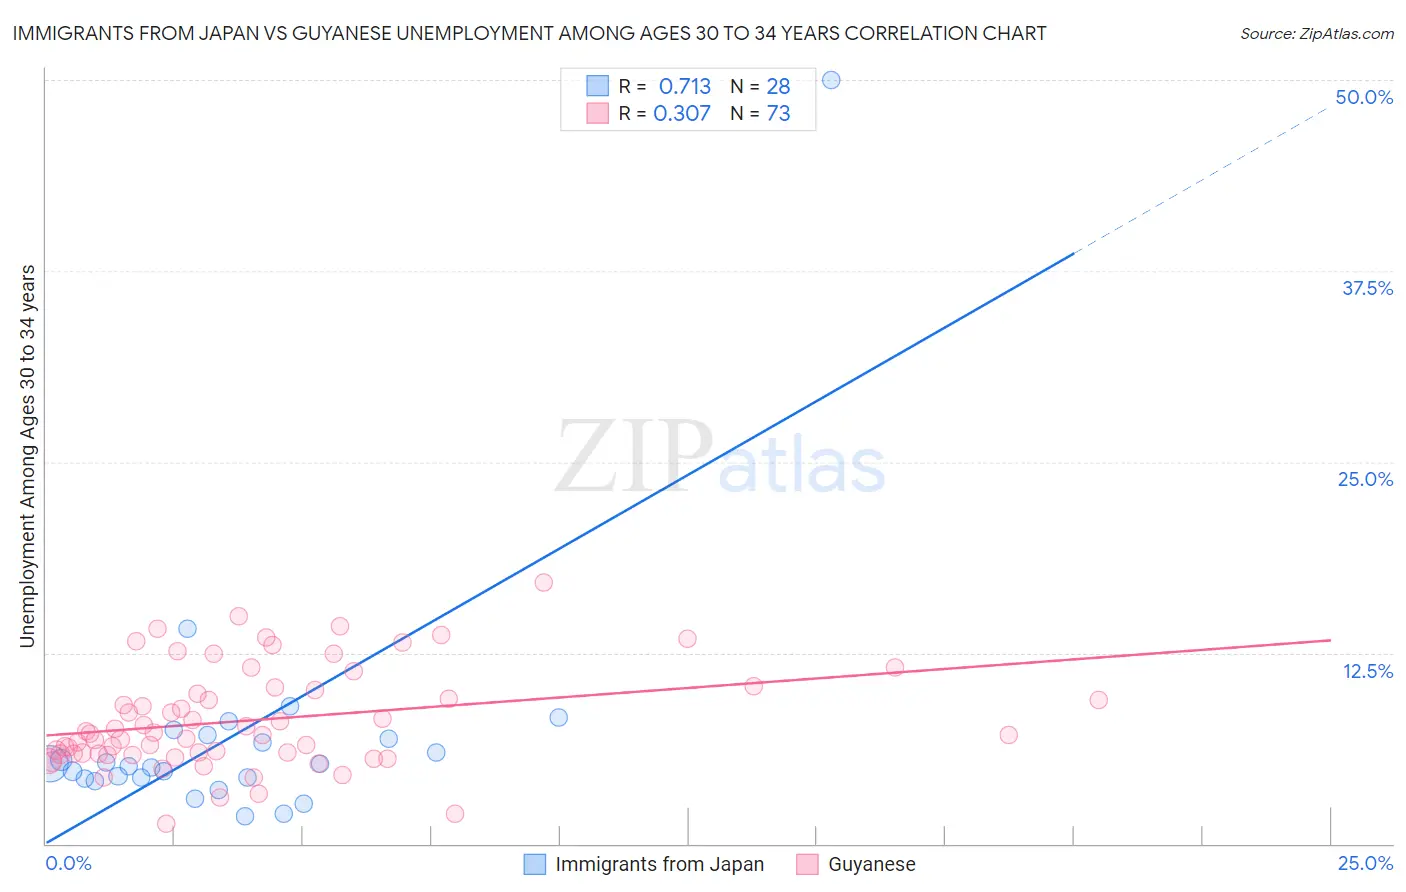
Immigrants from Japan vs Guyanese Unemployment Among Ages 30 to 34 years Correlation Chart
The statistical analysis conducted on geographies consisting of 324,511,302 people shows a strong positive correlation between the proportion of Immigrants from Japan and unemployment rate among population between the ages 30 and 34 in the United States with a correlation coefficient (R) of 0.713 and weighted average of 5.1%. Similarly, the statistical analysis conducted on geographies consisting of 172,436,836 people shows a mild positive correlation between the proportion of Guyanese and unemployment rate among population between the ages 30 and 34 in the United States with a correlation coefficient (R) of 0.307 and weighted average of 7.2%, a difference of 39.9%.
Unemployment Among Ages 30 to 34 years Correlation Summary
| Measurement | Immigrants from Japan | Guyanese |
| Minimum | 1.8% | 1.3% |
| Maximum | 50.0% | 17.1% |
| Range | 48.2% | 15.8% |
| Mean | 7.1% | 8.1% |
| Median | 5.1% | 7.2% |
| Interquartile 25% (IQ1) | 4.3% | 5.9% |
| Interquartile 75% (IQ3) | 7.0% | 10.2% |
| Interquartile Range (IQR) | 2.7% | 4.3% |
| Standard Deviation (Sample) | 8.8% | 3.3% |
| Standard Deviation (Population) | 8.6% | 3.3% |
Similar Demographics by Unemployment Among Ages 30 to 34 years
Demographics Similar to Immigrants from Japan by Unemployment Among Ages 30 to 34 years
In terms of unemployment among ages 30 to 34 years, the demographic groups most similar to Immigrants from Japan are Immigrants from Eastern Asia (5.1%, a difference of 0.070%), Immigrants from Zimbabwe (5.1%, a difference of 0.070%), Belgian (5.1%, a difference of 0.10%), Immigrants from France (5.1%, a difference of 0.11%), and Indian (Asian) (5.1%, a difference of 0.13%).
| Demographics | Rating | Rank | Unemployment Among Ages 30 to 34 years |
| Asians | 97.2 /100 | #58 | Exceptional 5.1% |
| Swedes | 97.1 /100 | #59 | Exceptional 5.1% |
| Immigrants | Somalia | 97.1 /100 | #60 | Exceptional 5.1% |
| Indians (Asian) | 97.0 /100 | #61 | Exceptional 5.1% |
| Immigrants | France | 97.0 /100 | #62 | Exceptional 5.1% |
| Belgians | 97.0 /100 | #63 | Exceptional 5.1% |
| Immigrants | Eastern Asia | 96.9 /100 | #64 | Exceptional 5.1% |
| Immigrants | Japan | 96.8 /100 | #65 | Exceptional 5.1% |
| Immigrants | Zimbabwe | 96.7 /100 | #66 | Exceptional 5.1% |
| Burmese | 96.5 /100 | #67 | Exceptional 5.1% |
| Jordanians | 96.5 /100 | #68 | Exceptional 5.1% |
| Immigrants | Northern Africa | 96.4 /100 | #69 | Exceptional 5.1% |
| Immigrants | Iraq | 96.4 /100 | #70 | Exceptional 5.1% |
| Paraguayans | 96.4 /100 | #71 | Exceptional 5.1% |
| Immigrants | Moldova | 96.4 /100 | #72 | Exceptional 5.1% |
Demographics Similar to Guyanese by Unemployment Among Ages 30 to 34 years
In terms of unemployment among ages 30 to 34 years, the demographic groups most similar to Guyanese are Cape Verdean (7.2%, a difference of 0.020%), Black/African American (7.2%, a difference of 0.060%), Immigrants from Cabo Verde (7.2%, a difference of 0.16%), Immigrants from Guyana (7.2%, a difference of 0.31%), and Houma (7.2%, a difference of 0.43%).
| Demographics | Rating | Rank | Unemployment Among Ages 30 to 34 years |
| British West Indians | 0.0 /100 | #312 | Tragic 7.0% |
| Ute | 0.0 /100 | #313 | Tragic 7.0% |
| Lumbee | 0.0 /100 | #314 | Tragic 7.1% |
| Aleuts | 0.0 /100 | #315 | Tragic 7.1% |
| Houma | 0.0 /100 | #316 | Tragic 7.2% |
| Immigrants | Cabo Verde | 0.0 /100 | #317 | Tragic 7.2% |
| Blacks/African Americans | 0.0 /100 | #318 | Tragic 7.2% |
| Guyanese | 0.0 /100 | #319 | Tragic 7.2% |
| Cape Verdeans | 0.0 /100 | #320 | Tragic 7.2% |
| Immigrants | Guyana | 0.0 /100 | #321 | Tragic 7.2% |
| Marshallese | 0.0 /100 | #322 | Tragic 7.2% |
| Immigrants | Yemen | 0.0 /100 | #323 | Tragic 7.3% |
| Immigrants | Dominica | 0.0 /100 | #324 | Tragic 7.3% |
| Apache | 0.0 /100 | #325 | Tragic 7.3% |
| Dominicans | 0.0 /100 | #326 | Tragic 7.7% |