Immigrants from Jamaica vs South American Unemployment Among Ages 16 to 19 years
COMPARE
Immigrants from Jamaica
South American
Unemployment Among Ages 16 to 19 years
Unemployment Among Ages 16 to 19 years Comparison
Immigrants from Jamaica
South Americans
22.2%
UNEMPLOYMENT AMONG AGES 16 TO 19 YEARS
0.0/ 100
METRIC RATING
318th/ 347
METRIC RANK
18.3%
UNEMPLOYMENT AMONG AGES 16 TO 19 YEARS
2.6/ 100
METRIC RATING
238th/ 347
METRIC RANK
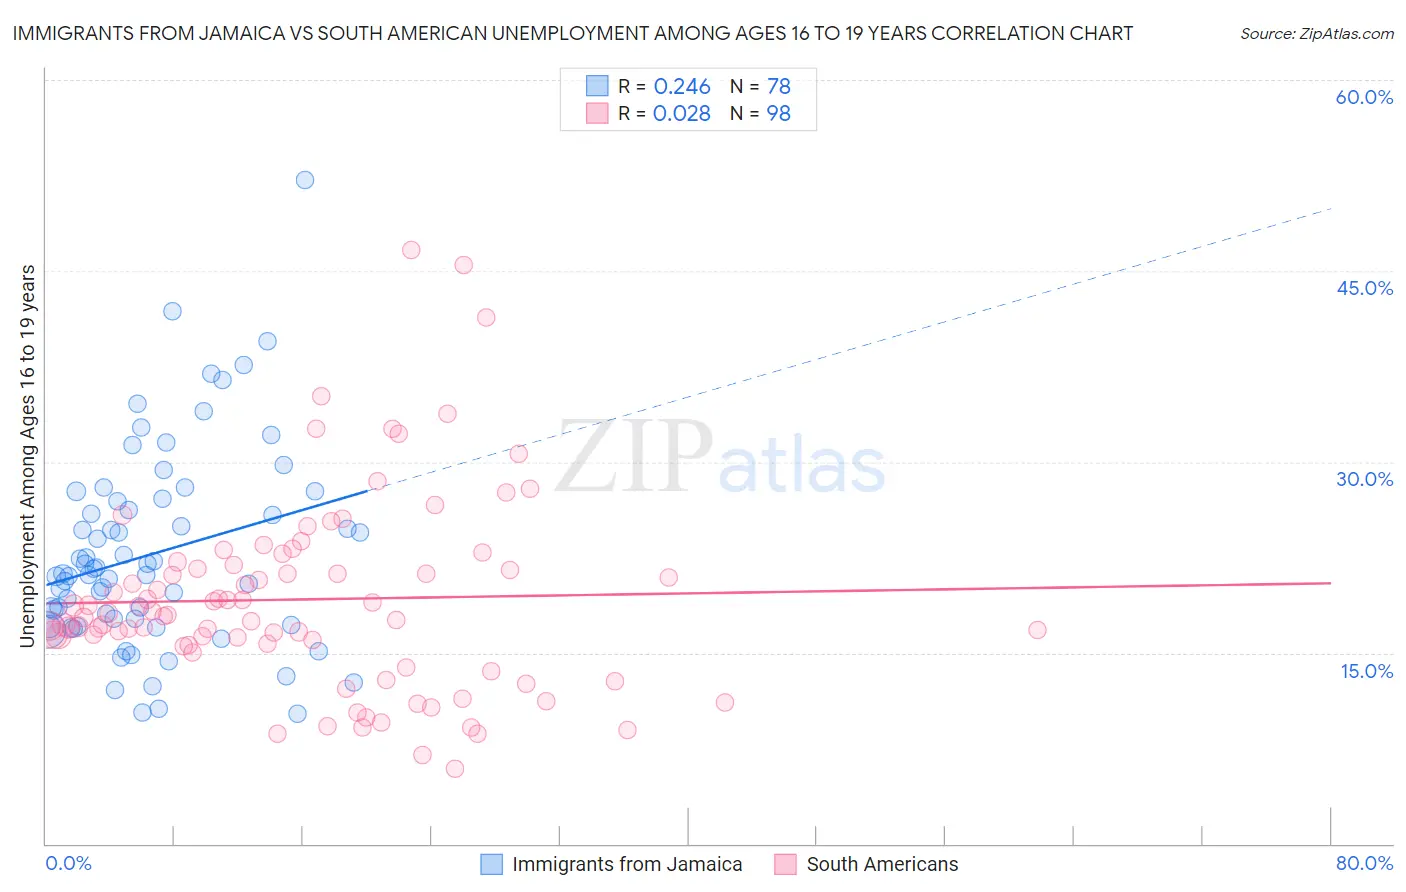
Immigrants from Jamaica vs South American Unemployment Among Ages 16 to 19 years Correlation Chart
The statistical analysis conducted on geographies consisting of 289,656,890 people shows a weak positive correlation between the proportion of Immigrants from Jamaica and unemployment rate among population between the ages 16 and 19 in the United States with a correlation coefficient (R) of 0.246 and weighted average of 22.2%. Similarly, the statistical analysis conducted on geographies consisting of 460,023,329 people shows no correlation between the proportion of South Americans and unemployment rate among population between the ages 16 and 19 in the United States with a correlation coefficient (R) of 0.028 and weighted average of 18.3%, a difference of 21.1%.
Unemployment Among Ages 16 to 19 years Correlation Summary
| Measurement | Immigrants from Jamaica | South American |
| Minimum | 10.2% | 5.9% |
| Maximum | 52.1% | 46.6% |
| Range | 41.9% | 40.7% |
| Mean | 22.8% | 19.2% |
| Median | 21.2% | 17.9% |
| Interquartile 25% (IQ1) | 17.2% | 15.6% |
| Interquartile 75% (IQ3) | 26.9% | 21.9% |
| Interquartile Range (IQR) | 9.7% | 6.2% |
| Standard Deviation (Sample) | 7.8% | 7.6% |
| Standard Deviation (Population) | 7.8% | 7.6% |
Similar Demographics by Unemployment Among Ages 16 to 19 years
Demographics Similar to Immigrants from Jamaica by Unemployment Among Ages 16 to 19 years
In terms of unemployment among ages 16 to 19 years, the demographic groups most similar to Immigrants from Jamaica are Immigrants from Belize (22.2%, a difference of 0.15%), Immigrants from West Indies (22.2%, a difference of 0.16%), Cheyenne (22.3%, a difference of 0.39%), Tohono O'odham (22.1%, a difference of 0.59%), and West Indian (22.4%, a difference of 1.1%).
| Demographics | Rating | Rank | Unemployment Among Ages 16 to 19 years |
| Belizeans | 0.0 /100 | #311 | Tragic 21.6% |
| Houma | 0.0 /100 | #312 | Tragic 21.6% |
| Jamaicans | 0.0 /100 | #313 | Tragic 21.7% |
| Alaska Natives | 0.0 /100 | #314 | Tragic 21.8% |
| Immigrants | Dominica | 0.0 /100 | #315 | Tragic 21.9% |
| Tohono O'odham | 0.0 /100 | #316 | Tragic 22.1% |
| Immigrants | Belize | 0.0 /100 | #317 | Tragic 22.2% |
| Immigrants | Jamaica | 0.0 /100 | #318 | Tragic 22.2% |
| Immigrants | West Indies | 0.0 /100 | #319 | Tragic 22.2% |
| Cheyenne | 0.0 /100 | #320 | Tragic 22.3% |
| West Indians | 0.0 /100 | #321 | Tragic 22.4% |
| Barbadians | 0.0 /100 | #322 | Tragic 22.5% |
| Yakama | 0.0 /100 | #323 | Tragic 22.5% |
| Immigrants | Armenia | 0.0 /100 | #324 | Tragic 22.6% |
| Trinidadians and Tobagonians | 0.0 /100 | #325 | Tragic 22.6% |
Demographics Similar to South Americans by Unemployment Among Ages 16 to 19 years
In terms of unemployment among ages 16 to 19 years, the demographic groups most similar to South Americans are Immigrants (18.3%, a difference of 0.020%), Immigrants from Colombia (18.3%, a difference of 0.030%), Native Hawaiian (18.3%, a difference of 0.080%), French American Indian (18.3%, a difference of 0.10%), and Immigrants from Cabo Verde (18.4%, a difference of 0.30%).
| Demographics | Rating | Rank | Unemployment Among Ages 16 to 19 years |
| Nepalese | 4.2 /100 | #231 | Tragic 18.2% |
| Immigrants | Russia | 4.0 /100 | #232 | Tragic 18.2% |
| Seminole | 4.0 /100 | #233 | Tragic 18.2% |
| Colombians | 3.7 /100 | #234 | Tragic 18.3% |
| French American Indians | 2.9 /100 | #235 | Tragic 18.3% |
| Immigrants | Colombia | 2.7 /100 | #236 | Tragic 18.3% |
| Immigrants | Immigrants | 2.7 /100 | #237 | Tragic 18.3% |
| South Americans | 2.6 /100 | #238 | Tragic 18.3% |
| Native Hawaiians | 2.4 /100 | #239 | Tragic 18.3% |
| Immigrants | Cabo Verde | 2.0 /100 | #240 | Tragic 18.4% |
| Immigrants | Ukraine | 1.3 /100 | #241 | Tragic 18.5% |
| Moroccans | 1.1 /100 | #242 | Tragic 18.5% |
| Mexicans | 0.9 /100 | #243 | Tragic 18.5% |
| Guatemalans | 0.8 /100 | #244 | Tragic 18.6% |
| Immigrants | Belarus | 0.8 /100 | #245 | Tragic 18.6% |