Immigrants from Jamaica vs Immigrants from Eastern Africa Unemployment Among Ages 60 to 64 years
COMPARE
Immigrants from Jamaica
Immigrants from Eastern Africa
Unemployment Among Ages 60 to 64 years
Unemployment Among Ages 60 to 64 years Comparison
Immigrants from Jamaica
Immigrants from Eastern Africa
5.4%
UNEMPLOYMENT AMONG AGES 60 TO 64 YEARS
0.0/ 100
METRIC RATING
301st/ 347
METRIC RANK
4.6%
UNEMPLOYMENT AMONG AGES 60 TO 64 YEARS
99.5/ 100
METRIC RATING
73rd/ 347
METRIC RANK
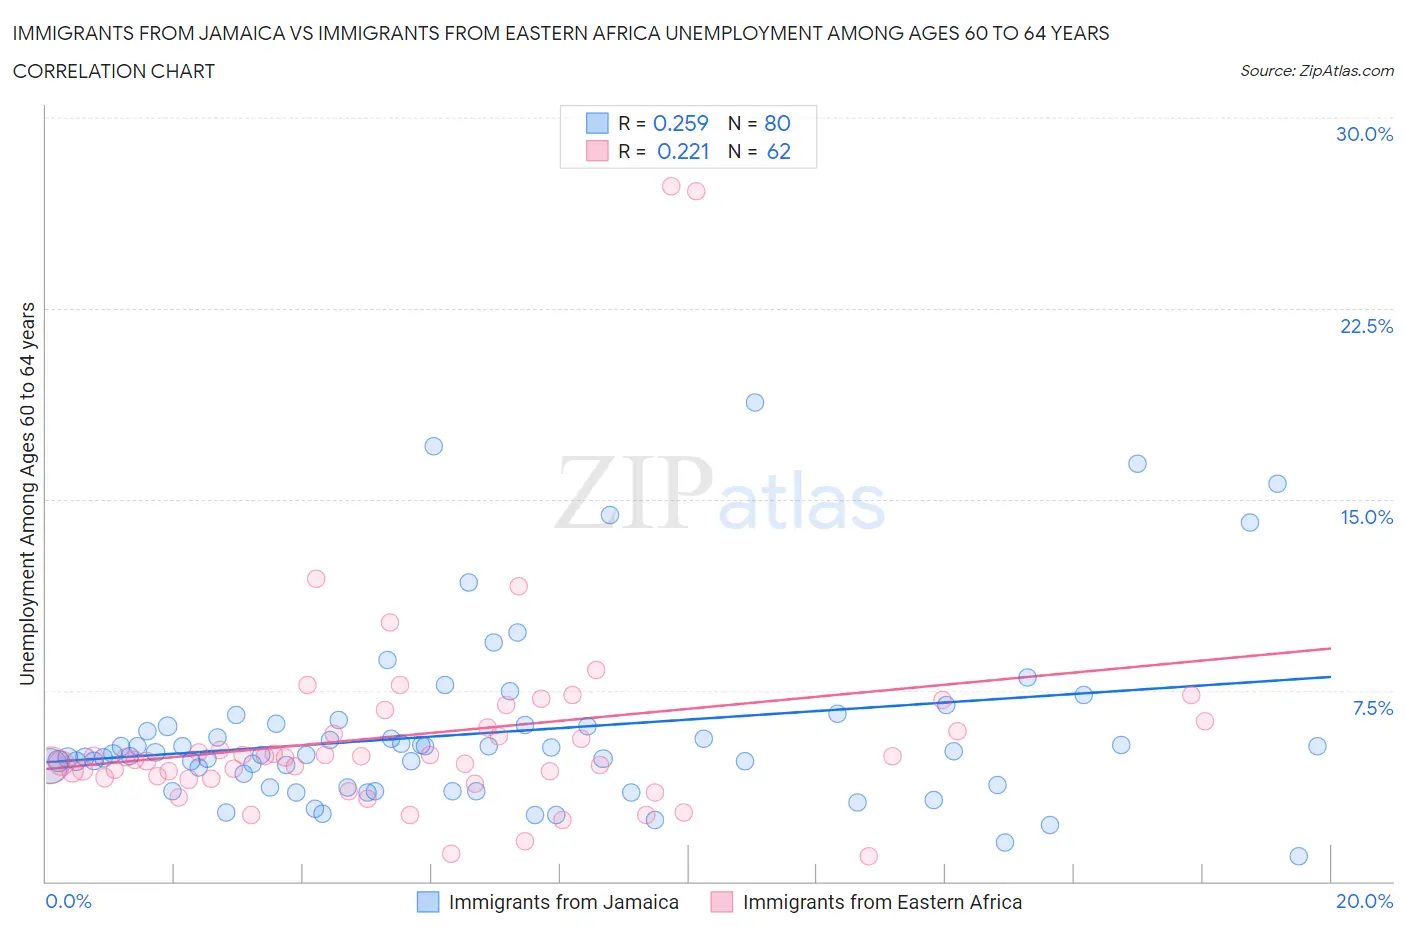
Immigrants from Jamaica vs Immigrants from Eastern Africa Unemployment Among Ages 60 to 64 years Correlation Chart
The statistical analysis conducted on geographies consisting of 280,123,612 people shows a weak positive correlation between the proportion of Immigrants from Jamaica and unemployment rate among population between the ages 60 and 64 in the United States with a correlation coefficient (R) of 0.259 and weighted average of 5.4%. Similarly, the statistical analysis conducted on geographies consisting of 325,874,753 people shows a weak positive correlation between the proportion of Immigrants from Eastern Africa and unemployment rate among population between the ages 60 and 64 in the United States with a correlation coefficient (R) of 0.221 and weighted average of 4.6%, a difference of 15.8%.
Unemployment Among Ages 60 to 64 years Correlation Summary
| Measurement | Immigrants from Jamaica | Immigrants from Eastern Africa |
| Minimum | 1.0% | 1.0% |
| Maximum | 18.8% | 27.3% |
| Range | 17.8% | 26.3% |
| Mean | 5.8% | 5.8% |
| Median | 5.0% | 4.9% |
| Interquartile 25% (IQ1) | 3.7% | 4.1% |
| Interquartile 75% (IQ3) | 6.1% | 6.1% |
| Interquartile Range (IQR) | 2.4% | 2.0% |
| Standard Deviation (Sample) | 3.5% | 4.5% |
| Standard Deviation (Population) | 3.4% | 4.4% |
Similar Demographics by Unemployment Among Ages 60 to 64 years
Demographics Similar to Immigrants from Jamaica by Unemployment Among Ages 60 to 64 years
In terms of unemployment among ages 60 to 64 years, the demographic groups most similar to Immigrants from Jamaica are Immigrants from Barbados (5.4%, a difference of 0.020%), Immigrants from El Salvador (5.4%, a difference of 0.050%), Immigrants from Central America (5.4%, a difference of 0.10%), Osage (5.4%, a difference of 0.15%), and Barbadian (5.4%, a difference of 0.40%).
| Demographics | Rating | Rank | Unemployment Among Ages 60 to 64 years |
| Blacks/African Americans | 0.0 /100 | #294 | Tragic 5.3% |
| Armenians | 0.0 /100 | #295 | Tragic 5.3% |
| Jamaicans | 0.0 /100 | #296 | Tragic 5.3% |
| Osage | 0.0 /100 | #297 | Tragic 5.4% |
| Immigrants | Central America | 0.0 /100 | #298 | Tragic 5.4% |
| Immigrants | El Salvador | 0.0 /100 | #299 | Tragic 5.4% |
| Immigrants | Barbados | 0.0 /100 | #300 | Tragic 5.4% |
| Immigrants | Jamaica | 0.0 /100 | #301 | Tragic 5.4% |
| Barbadians | 0.0 /100 | #302 | Tragic 5.4% |
| Bahamians | 0.0 /100 | #303 | Tragic 5.4% |
| Immigrants | Mexico | 0.0 /100 | #304 | Tragic 5.4% |
| Cypriots | 0.0 /100 | #305 | Tragic 5.4% |
| Immigrants | Dominica | 0.0 /100 | #306 | Tragic 5.4% |
| Immigrants | Guyana | 0.0 /100 | #307 | Tragic 5.4% |
| Spanish American Indians | 0.0 /100 | #308 | Tragic 5.4% |
Demographics Similar to Immigrants from Eastern Africa by Unemployment Among Ages 60 to 64 years
In terms of unemployment among ages 60 to 64 years, the demographic groups most similar to Immigrants from Eastern Africa are Tongan (4.6%, a difference of 0.020%), Slavic (4.6%, a difference of 0.030%), Croatian (4.6%, a difference of 0.11%), Northern European (4.6%, a difference of 0.18%), and Creek (4.6%, a difference of 0.19%).
| Demographics | Rating | Rank | Unemployment Among Ages 60 to 64 years |
| Hawaiians | 99.6 /100 | #66 | Exceptional 4.6% |
| Immigrants | Scotland | 99.6 /100 | #67 | Exceptional 4.6% |
| Immigrants | Laos | 99.6 /100 | #68 | Exceptional 4.6% |
| Creek | 99.6 /100 | #69 | Exceptional 4.6% |
| Croatians | 99.5 /100 | #70 | Exceptional 4.6% |
| Slavs | 99.5 /100 | #71 | Exceptional 4.6% |
| Tongans | 99.5 /100 | #72 | Exceptional 4.6% |
| Immigrants | Eastern Africa | 99.5 /100 | #73 | Exceptional 4.6% |
| Northern Europeans | 99.3 /100 | #74 | Exceptional 4.6% |
| Potawatomi | 99.3 /100 | #75 | Exceptional 4.6% |
| Slovaks | 99.3 /100 | #76 | Exceptional 4.6% |
| Immigrants | Somalia | 99.2 /100 | #77 | Exceptional 4.6% |
| Seminole | 99.2 /100 | #78 | Exceptional 4.7% |
| Irish | 99.2 /100 | #79 | Exceptional 4.7% |
| Icelanders | 99.1 /100 | #80 | Exceptional 4.7% |