Immigrants from Jamaica vs Honduran Unemployment Among Seniors over 75 years
COMPARE
Immigrants from Jamaica
Honduran
Unemployment Among Seniors over 75 years
Unemployment Among Seniors over 75 years Comparison
Immigrants from Jamaica
Hondurans
8.9%
UNEMPLOYMENT AMONG SENIORS OVER 75 YEARS
27.7/ 100
METRIC RATING
196th/ 347
METRIC RANK
8.4%
UNEMPLOYMENT AMONG SENIORS OVER 75 YEARS
96.2/ 100
METRIC RATING
127th/ 347
METRIC RANK
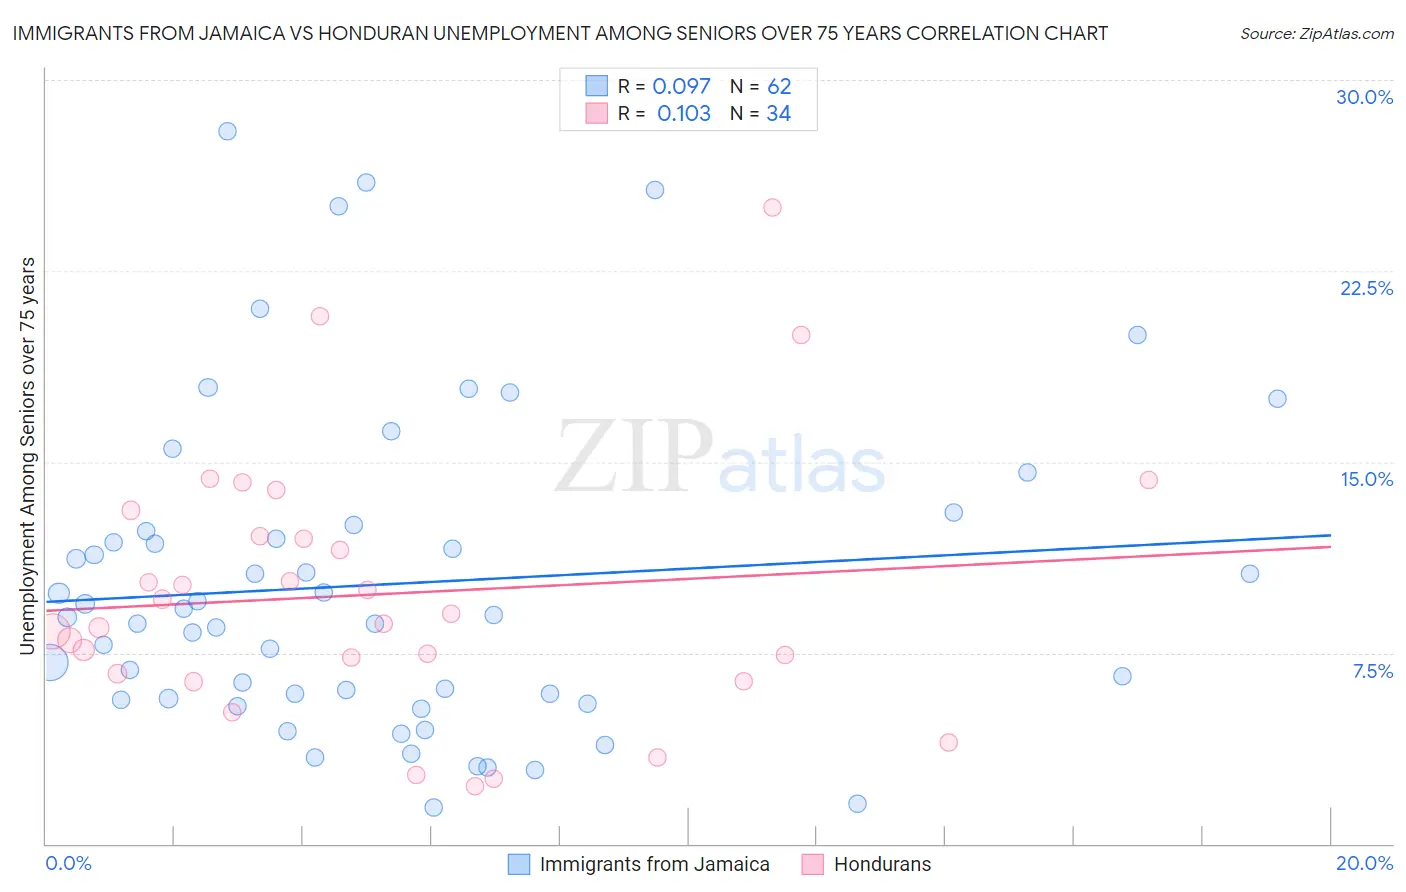
Immigrants from Jamaica vs Honduran Unemployment Among Seniors over 75 years Correlation Chart
The statistical analysis conducted on geographies consisting of 168,253,642 people shows a slight positive correlation between the proportion of Immigrants from Jamaica and unemployment rate among seniors over the age of 75 in the United States with a correlation coefficient (R) of 0.097 and weighted average of 8.9%. Similarly, the statistical analysis conducted on geographies consisting of 188,731,700 people shows a poor positive correlation between the proportion of Hondurans and unemployment rate among seniors over the age of 75 in the United States with a correlation coefficient (R) of 0.103 and weighted average of 8.4%, a difference of 5.9%.
Unemployment Among Seniors over 75 years Correlation Summary
| Measurement | Immigrants from Jamaica | Honduran |
| Minimum | 1.4% | 2.2% |
| Maximum | 28.0% | 25.0% |
| Range | 26.6% | 22.8% |
| Mean | 10.2% | 9.8% |
| Median | 8.9% | 8.8% |
| Interquartile 25% (IQ1) | 5.7% | 6.7% |
| Interquartile 75% (IQ3) | 12.3% | 12.1% |
| Interquartile Range (IQR) | 6.6% | 5.4% |
| Standard Deviation (Sample) | 6.2% | 5.2% |
| Standard Deviation (Population) | 6.2% | 5.1% |
Similar Demographics by Unemployment Among Seniors over 75 years
Demographics Similar to Immigrants from Jamaica by Unemployment Among Seniors over 75 years
In terms of unemployment among seniors over 75 years, the demographic groups most similar to Immigrants from Jamaica are Okinawan (8.8%, a difference of 0.070%), Maltese (8.8%, a difference of 0.090%), Immigrants from Laos (8.9%, a difference of 0.10%), Eastern European (8.9%, a difference of 0.12%), and Immigrants from Guyana (8.8%, a difference of 0.14%).
| Demographics | Rating | Rank | Unemployment Among Seniors over 75 years |
| Immigrants | Haiti | 34.7 /100 | #189 | Fair 8.8% |
| Mexican American Indians | 34.7 /100 | #190 | Fair 8.8% |
| Estonians | 33.3 /100 | #191 | Fair 8.8% |
| Immigrants | Kenya | 31.8 /100 | #192 | Fair 8.8% |
| Immigrants | Guyana | 29.9 /100 | #193 | Fair 8.8% |
| Maltese | 29.2 /100 | #194 | Fair 8.8% |
| Okinawans | 28.9 /100 | #195 | Fair 8.8% |
| Immigrants | Jamaica | 27.7 /100 | #196 | Fair 8.9% |
| Immigrants | Laos | 26.3 /100 | #197 | Fair 8.9% |
| Eastern Europeans | 25.9 /100 | #198 | Fair 8.9% |
| Pakistanis | 25.4 /100 | #199 | Fair 8.9% |
| Osage | 25.4 /100 | #200 | Fair 8.9% |
| Immigrants | Peru | 24.3 /100 | #201 | Fair 8.9% |
| Russians | 24.1 /100 | #202 | Fair 8.9% |
| Immigrants | Northern Europe | 23.9 /100 | #203 | Fair 8.9% |
Demographics Similar to Hondurans by Unemployment Among Seniors over 75 years
In terms of unemployment among seniors over 75 years, the demographic groups most similar to Hondurans are Belizean (8.4%, a difference of 0.010%), Native Hawaiian (8.4%, a difference of 0.050%), Ghanaian (8.4%, a difference of 0.080%), Immigrants from Moldova (8.3%, a difference of 0.21%), and Thai (8.3%, a difference of 0.23%).
| Demographics | Rating | Rank | Unemployment Among Seniors over 75 years |
| Immigrants | Asia | 97.4 /100 | #120 | Exceptional 8.3% |
| Immigrants | Croatia | 97.2 /100 | #121 | Exceptional 8.3% |
| Immigrants | Russia | 97.1 /100 | #122 | Exceptional 8.3% |
| Immigrants | Nepal | 96.9 /100 | #123 | Exceptional 8.3% |
| Thais | 96.8 /100 | #124 | Exceptional 8.3% |
| Immigrants | Moldova | 96.7 /100 | #125 | Exceptional 8.3% |
| Belizeans | 96.3 /100 | #126 | Exceptional 8.4% |
| Hondurans | 96.2 /100 | #127 | Exceptional 8.4% |
| Native Hawaiians | 96.1 /100 | #128 | Exceptional 8.4% |
| Ghanaians | 96.0 /100 | #129 | Exceptional 8.4% |
| Apache | 95.2 /100 | #130 | Exceptional 8.4% |
| German Russians | 94.9 /100 | #131 | Exceptional 8.4% |
| Chileans | 93.8 /100 | #132 | Exceptional 8.4% |
| Serbians | 93.7 /100 | #133 | Exceptional 8.4% |
| Immigrants | Czechoslovakia | 93.4 /100 | #134 | Exceptional 8.4% |