Immigrants from Israel vs Immigrants from Nigeria Unemployment Among Women with Children Under 18 years
COMPARE
Immigrants from Israel
Immigrants from Nigeria
Unemployment Among Women with Children Under 18 years
Unemployment Among Women with Children Under 18 years Comparison
Immigrants from Israel
Immigrants from Nigeria
5.3%
UNEMPLOYMENT AMONG WOMEN WITH CHILDREN UNDER 18 YEARS
81.9/ 100
METRIC RATING
131st/ 347
METRIC RANK
6.1%
UNEMPLOYMENT AMONG WOMEN WITH CHILDREN UNDER 18 YEARS
0.1/ 100
METRIC RATING
258th/ 347
METRIC RANK
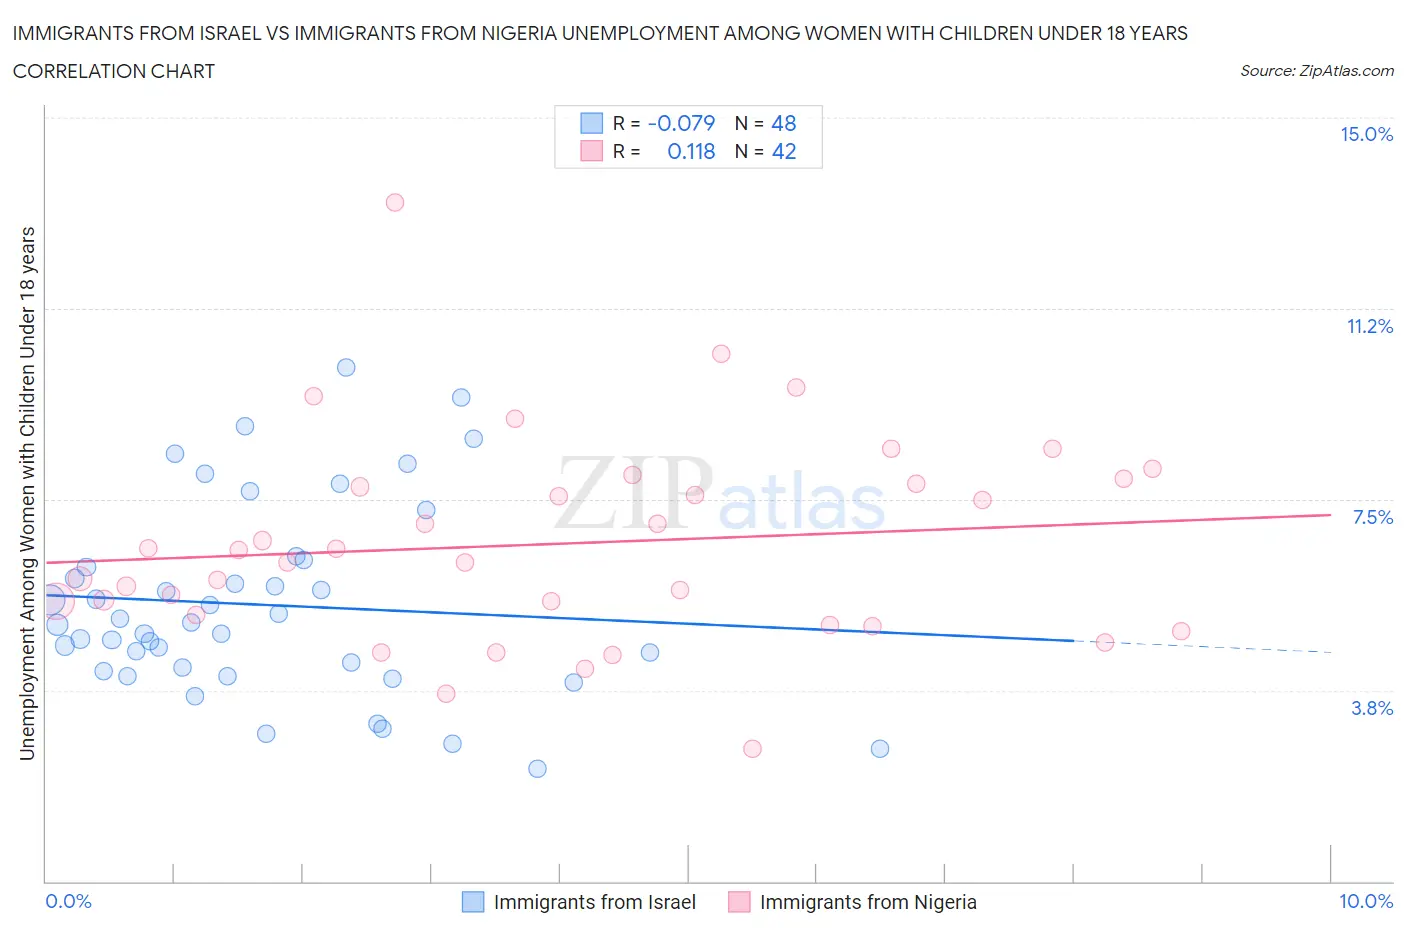
Immigrants from Israel vs Immigrants from Nigeria Unemployment Among Women with Children Under 18 years Correlation Chart
The statistical analysis conducted on geographies consisting of 205,523,587 people shows a slight negative correlation between the proportion of Immigrants from Israel and unemployment rate among women with children under the age of 18 in the United States with a correlation coefficient (R) of -0.079 and weighted average of 5.3%. Similarly, the statistical analysis conducted on geographies consisting of 278,032,483 people shows a poor positive correlation between the proportion of Immigrants from Nigeria and unemployment rate among women with children under the age of 18 in the United States with a correlation coefficient (R) of 0.118 and weighted average of 6.1%, a difference of 14.8%.
Unemployment Among Women with Children Under 18 years Correlation Summary
| Measurement | Immigrants from Israel | Immigrants from Nigeria |
| Minimum | 2.2% | 2.6% |
| Maximum | 10.1% | 13.3% |
| Range | 7.9% | 10.7% |
| Mean | 5.4% | 6.6% |
| Median | 5.1% | 6.4% |
| Interquartile 25% (IQ1) | 4.2% | 5.2% |
| Interquartile 75% (IQ3) | 6.2% | 7.8% |
| Interquartile Range (IQR) | 2.1% | 2.6% |
| Standard Deviation (Sample) | 1.9% | 2.0% |
| Standard Deviation (Population) | 1.9% | 2.0% |
Similar Demographics by Unemployment Among Women with Children Under 18 years
Demographics Similar to Immigrants from Israel by Unemployment Among Women with Children Under 18 years
In terms of unemployment among women with children under 18 years, the demographic groups most similar to Immigrants from Israel are Immigrants from Austria (5.3%, a difference of 0.020%), Immigrants from Italy (5.3%, a difference of 0.050%), Immigrants from Ethiopia (5.3%, a difference of 0.070%), Immigrants from South Africa (5.3%, a difference of 0.11%), and White/Caucasian (5.3%, a difference of 0.12%).
| Demographics | Rating | Rank | Unemployment Among Women with Children Under 18 years |
| Native Hawaiians | 84.0 /100 | #124 | Excellent 5.3% |
| Immigrants | North Macedonia | 83.2 /100 | #125 | Excellent 5.3% |
| Immigrants | Oceania | 83.1 /100 | #126 | Excellent 5.3% |
| Whites/Caucasians | 82.9 /100 | #127 | Excellent 5.3% |
| Immigrants | South Africa | 82.8 /100 | #128 | Excellent 5.3% |
| Immigrants | Italy | 82.3 /100 | #129 | Excellent 5.3% |
| Immigrants | Austria | 82.1 /100 | #130 | Excellent 5.3% |
| Immigrants | Israel | 81.9 /100 | #131 | Excellent 5.3% |
| Immigrants | Ethiopia | 81.4 /100 | #132 | Excellent 5.3% |
| Ethiopians | 80.7 /100 | #133 | Excellent 5.3% |
| Slovaks | 80.5 /100 | #134 | Excellent 5.3% |
| New Zealanders | 79.9 /100 | #135 | Good 5.3% |
| Immigrants | Jordan | 79.5 /100 | #136 | Good 5.3% |
| Jordanians | 78.8 /100 | #137 | Good 5.3% |
| Argentineans | 78.8 /100 | #138 | Good 5.3% |
Demographics Similar to Immigrants from Nigeria by Unemployment Among Women with Children Under 18 years
In terms of unemployment among women with children under 18 years, the demographic groups most similar to Immigrants from Nigeria are Bermudan (6.1%, a difference of 0.19%), Ottawa (6.1%, a difference of 0.67%), Nigerian (6.1%, a difference of 0.69%), Nepalese (6.0%, a difference of 0.71%), and Liberian (6.0%, a difference of 0.79%).
| Demographics | Rating | Rank | Unemployment Among Women with Children Under 18 years |
| Ute | 0.7 /100 | #251 | Tragic 5.9% |
| Seminole | 0.5 /100 | #252 | Tragic 6.0% |
| Immigrants | Congo | 0.4 /100 | #253 | Tragic 6.0% |
| Immigrants | Azores | 0.3 /100 | #254 | Tragic 6.0% |
| Liberians | 0.2 /100 | #255 | Tragic 6.0% |
| Nepalese | 0.2 /100 | #256 | Tragic 6.0% |
| Bermudans | 0.1 /100 | #257 | Tragic 6.1% |
| Immigrants | Nigeria | 0.1 /100 | #258 | Tragic 6.1% |
| Ottawa | 0.1 /100 | #259 | Tragic 6.1% |
| Nigerians | 0.1 /100 | #260 | Tragic 6.1% |
| Immigrants | Liberia | 0.1 /100 | #261 | Tragic 6.1% |
| Immigrants | Trinidad and Tobago | 0.1 /100 | #262 | Tragic 6.1% |
| Spanish American Indians | 0.1 /100 | #263 | Tragic 6.1% |
| Comanche | 0.1 /100 | #264 | Tragic 6.1% |
| Immigrants | Bahamas | 0.1 /100 | #265 | Tragic 6.1% |