Immigrants from Iraq vs European Unemployment Among Ages 45 to 54 years
COMPARE
Immigrants from Iraq
European
Unemployment Among Ages 45 to 54 years
Unemployment Among Ages 45 to 54 years Comparison
Immigrants from Iraq
Europeans
4.7%
UNEMPLOYMENT AMONG AGES 45 TO 54 YEARS
1.3/ 100
METRIC RATING
240th/ 347
METRIC RANK
4.1%
UNEMPLOYMENT AMONG AGES 45 TO 54 YEARS
100.0/ 100
METRIC RATING
21st/ 347
METRIC RANK
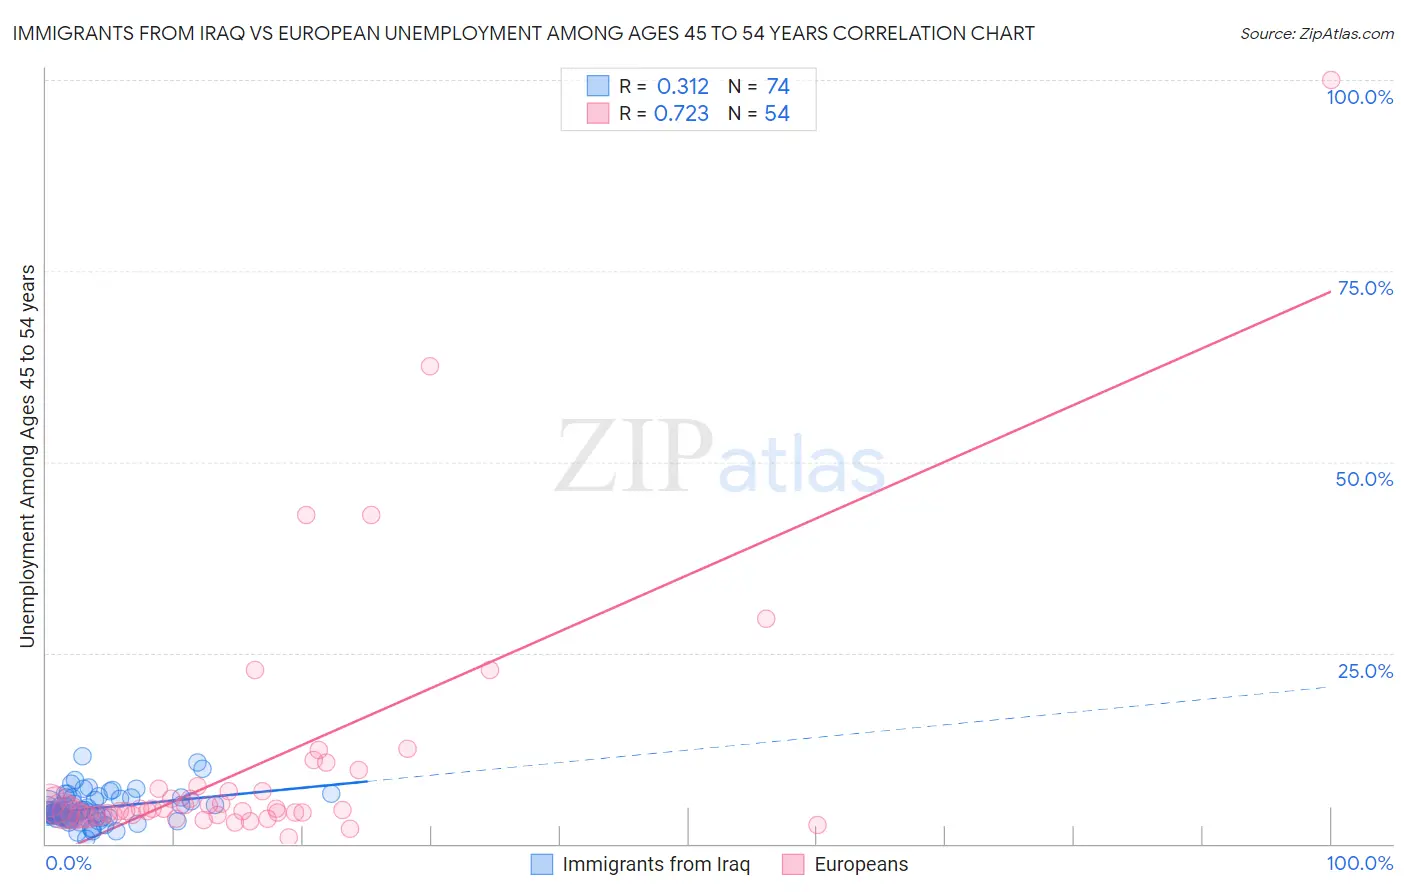
Immigrants from Iraq vs European Unemployment Among Ages 45 to 54 years Correlation Chart
The statistical analysis conducted on geographies consisting of 192,988,418 people shows a mild positive correlation between the proportion of Immigrants from Iraq and unemployment rate among population between the ages 45 and 54 in the United States with a correlation coefficient (R) of 0.312 and weighted average of 4.7%. Similarly, the statistical analysis conducted on geographies consisting of 522,496,138 people shows a strong positive correlation between the proportion of Europeans and unemployment rate among population between the ages 45 and 54 in the United States with a correlation coefficient (R) of 0.723 and weighted average of 4.1%, a difference of 16.2%.
Unemployment Among Ages 45 to 54 years Correlation Summary
| Measurement | Immigrants from Iraq | European |
| Minimum | 0.60% | 0.90% |
| Maximum | 11.4% | 100.0% |
| Range | 10.8% | 99.1% |
| Mean | 4.6% | 10.4% |
| Median | 4.2% | 4.5% |
| Interquartile 25% (IQ1) | 3.4% | 3.8% |
| Interquartile 75% (IQ3) | 5.9% | 7.2% |
| Interquartile Range (IQR) | 2.5% | 3.5% |
| Standard Deviation (Sample) | 2.0% | 16.9% |
| Standard Deviation (Population) | 2.0% | 16.8% |
Similar Demographics by Unemployment Among Ages 45 to 54 years
Demographics Similar to Immigrants from Iraq by Unemployment Among Ages 45 to 54 years
In terms of unemployment among ages 45 to 54 years, the demographic groups most similar to Immigrants from Iraq are Yaqui (4.7%, a difference of 0.030%), Spanish American (4.7%, a difference of 0.030%), Delaware (4.8%, a difference of 0.070%), Central American (4.8%, a difference of 0.070%), and Portuguese (4.8%, a difference of 0.19%).
| Demographics | Rating | Rank | Unemployment Among Ages 45 to 54 years |
| Immigrants | Immigrants | 2.6 /100 | #233 | Tragic 4.7% |
| Soviet Union | 2.6 /100 | #234 | Tragic 4.7% |
| Cree | 2.3 /100 | #235 | Tragic 4.7% |
| Tlingit-Haida | 2.3 /100 | #236 | Tragic 4.7% |
| Alsatians | 1.6 /100 | #237 | Tragic 4.7% |
| Yaqui | 1.4 /100 | #238 | Tragic 4.7% |
| Spanish Americans | 1.4 /100 | #239 | Tragic 4.7% |
| Immigrants | Iraq | 1.3 /100 | #240 | Tragic 4.7% |
| Delaware | 1.3 /100 | #241 | Tragic 4.8% |
| Central Americans | 1.3 /100 | #242 | Tragic 4.8% |
| Portuguese | 1.1 /100 | #243 | Tragic 4.8% |
| Seminole | 1.1 /100 | #244 | Tragic 4.8% |
| Immigrants | Albania | 0.9 /100 | #245 | Tragic 4.8% |
| Immigrants | Syria | 0.9 /100 | #246 | Tragic 4.8% |
| Israelis | 0.9 /100 | #247 | Tragic 4.8% |
Demographics Similar to Europeans by Unemployment Among Ages 45 to 54 years
In terms of unemployment among ages 45 to 54 years, the demographic groups most similar to Europeans are Yugoslavian (4.1%, a difference of 0.090%), Bulgarian (4.1%, a difference of 0.10%), English (4.1%, a difference of 0.33%), Swiss (4.1%, a difference of 0.49%), and Carpatho Rusyn (4.1%, a difference of 0.74%).
| Demographics | Rating | Rank | Unemployment Among Ages 45 to 54 years |
| Immigrants | Bosnia and Herzegovina | 100.0 /100 | #14 | Exceptional 4.0% |
| Immigrants | Bolivia | 100.0 /100 | #15 | Exceptional 4.0% |
| Thais | 100.0 /100 | #16 | Exceptional 4.0% |
| Tongans | 100.0 /100 | #17 | Exceptional 4.1% |
| Germans | 100.0 /100 | #18 | Exceptional 4.1% |
| Swiss | 100.0 /100 | #19 | Exceptional 4.1% |
| English | 100.0 /100 | #20 | Exceptional 4.1% |
| Europeans | 100.0 /100 | #21 | Exceptional 4.1% |
| Yugoslavians | 100.0 /100 | #22 | Exceptional 4.1% |
| Bulgarians | 100.0 /100 | #23 | Exceptional 4.1% |
| Carpatho Rusyns | 100.0 /100 | #24 | Exceptional 4.1% |
| Bolivians | 99.9 /100 | #25 | Exceptional 4.1% |
| Scottish | 99.9 /100 | #26 | Exceptional 4.1% |
| Immigrants | Moldova | 99.9 /100 | #27 | Exceptional 4.1% |
| Welsh | 99.9 /100 | #28 | Exceptional 4.1% |