Immigrants from Iran vs Slovak Unemployment Among Ages 35 to 44 years
COMPARE
Immigrants from Iran
Slovak
Unemployment Among Ages 35 to 44 years
Unemployment Among Ages 35 to 44 years Comparison
Immigrants from Iran
Slovaks
4.6%
UNEMPLOYMENT AMONG AGES 35 TO 44 YEARS
63.1/ 100
METRIC RATING
158th/ 347
METRIC RANK
4.7%
UNEMPLOYMENT AMONG AGES 35 TO 44 YEARS
44.6/ 100
METRIC RATING
177th/ 347
METRIC RANK
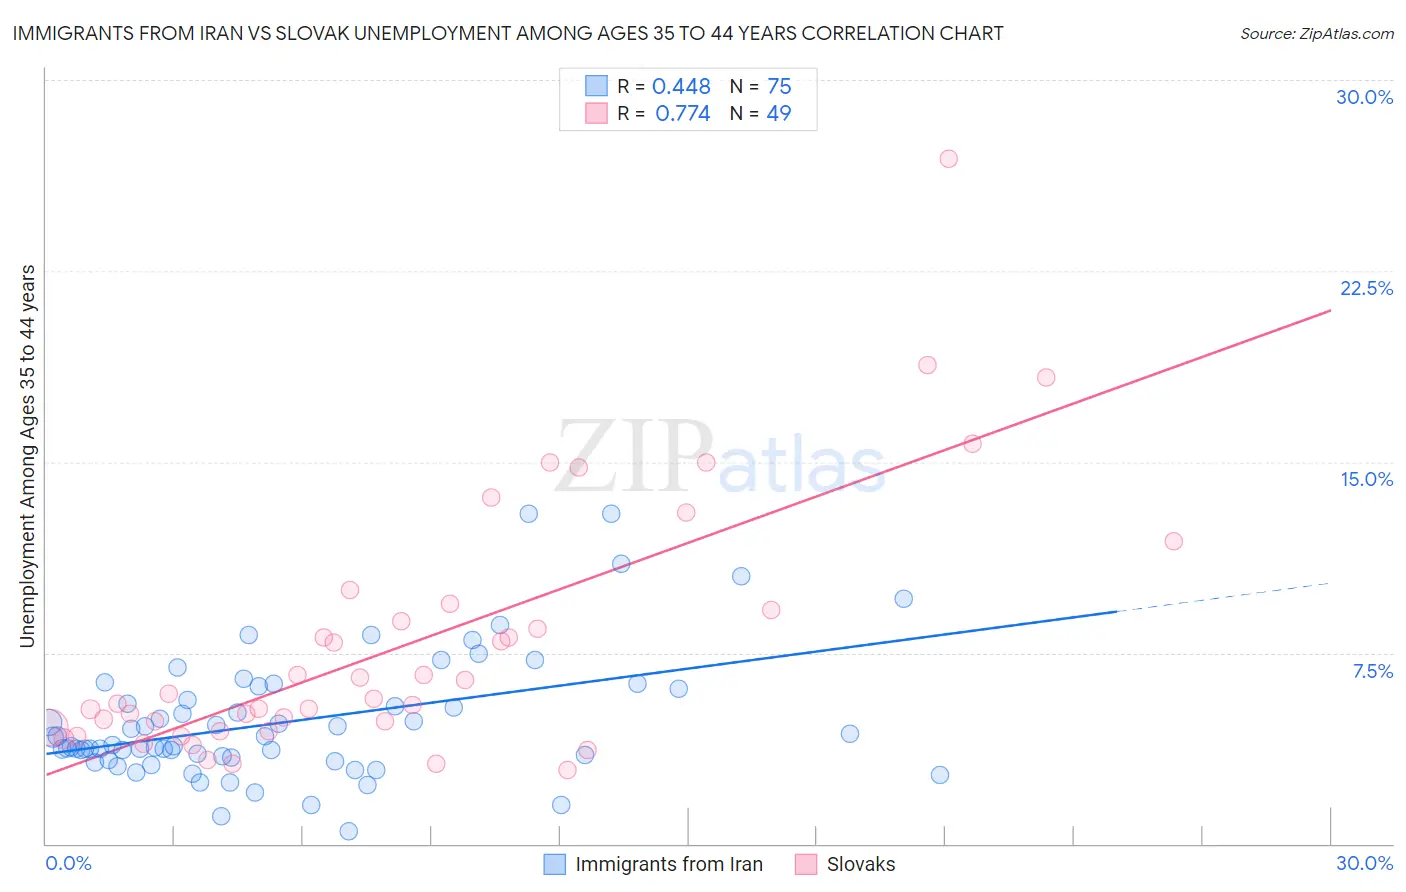
Immigrants from Iran vs Slovak Unemployment Among Ages 35 to 44 years Correlation Chart
The statistical analysis conducted on geographies consisting of 276,389,591 people shows a moderate positive correlation between the proportion of Immigrants from Iran and unemployment rate among population between the ages 35 and 44 in the United States with a correlation coefficient (R) of 0.448 and weighted average of 4.6%. Similarly, the statistical analysis conducted on geographies consisting of 384,713,157 people shows a strong positive correlation between the proportion of Slovaks and unemployment rate among population between the ages 35 and 44 in the United States with a correlation coefficient (R) of 0.774 and weighted average of 4.7%, a difference of 1.3%.
Unemployment Among Ages 35 to 44 years Correlation Summary
| Measurement | Immigrants from Iran | Slovak |
| Minimum | 0.50% | 2.9% |
| Maximum | 13.0% | 26.9% |
| Range | 12.5% | 24.0% |
| Mean | 4.8% | 7.9% |
| Median | 3.9% | 5.7% |
| Interquartile 25% (IQ1) | 3.4% | 4.5% |
| Interquartile 75% (IQ3) | 6.1% | 9.3% |
| Interquartile Range (IQR) | 2.7% | 4.8% |
| Standard Deviation (Sample) | 2.5% | 5.0% |
| Standard Deviation (Population) | 2.5% | 4.9% |
Demographics Similar to Immigrants from Iran and Slovaks by Unemployment Among Ages 35 to 44 years
In terms of unemployment among ages 35 to 44 years, the demographic groups most similar to Immigrants from Iran are Albanian (4.6%, a difference of 0.010%), Immigrants from Belarus (4.6%, a difference of 0.020%), Hungarian (4.6%, a difference of 0.040%), Celtic (4.7%, a difference of 0.11%), and Costa Rican (4.7%, a difference of 0.27%). Similarly, the demographic groups most similar to Slovaks are Immigrants from Uganda (4.7%, a difference of 0.25%), Immigrants from Germany (4.7%, a difference of 0.31%), Afghan (4.7%, a difference of 0.38%), Iraqi (4.7%, a difference of 0.44%), and Lebanese (4.7%, a difference of 0.48%).
| Demographics | Rating | Rank | Unemployment Among Ages 35 to 44 years |
| Immigrants | Belarus | 63.4 /100 | #157 | Good 4.6% |
| Immigrants | Iran | 63.1 /100 | #158 | Good 4.6% |
| Albanians | 63.0 /100 | #159 | Good 4.6% |
| Hungarians | 62.6 /100 | #160 | Good 4.6% |
| Celtics | 61.7 /100 | #161 | Good 4.7% |
| Costa Ricans | 59.6 /100 | #162 | Average 4.7% |
| South Africans | 58.5 /100 | #163 | Average 4.7% |
| Immigrants | Morocco | 57.2 /100 | #164 | Average 4.7% |
| German Russians | 57.2 /100 | #165 | Average 4.7% |
| French | 55.6 /100 | #166 | Average 4.7% |
| Peruvians | 54.4 /100 | #167 | Average 4.7% |
| Arabs | 53.1 /100 | #168 | Average 4.7% |
| Pennsylvania Germans | 53.0 /100 | #169 | Average 4.7% |
| Immigrants | Indonesia | 52.6 /100 | #170 | Average 4.7% |
| Indonesians | 51.7 /100 | #171 | Average 4.7% |
| Lebanese | 51.4 /100 | #172 | Average 4.7% |
| Iraqis | 50.9 /100 | #173 | Average 4.7% |
| Afghans | 50.0 /100 | #174 | Average 4.7% |
| Immigrants | Germany | 48.9 /100 | #175 | Average 4.7% |
| Immigrants | Uganda | 48.1 /100 | #176 | Average 4.7% |
| Slovaks | 44.6 /100 | #177 | Average 4.7% |