Immigrants from Iran vs Immigrants from Hong Kong Unemployment Among Youth under 25 years
COMPARE
Immigrants from Iran
Immigrants from Hong Kong
Unemployment Among Youth under 25 years
Unemployment Among Youth under 25 years Comparison
Immigrants from Iran
Immigrants from Hong Kong
12.0%
UNEMPLOYMENT AMONG YOUTH UNDER 25 YEARS
2.6/ 100
METRIC RATING
227th/ 347
METRIC RANK
11.6%
UNEMPLOYMENT AMONG YOUTH UNDER 25 YEARS
42.4/ 100
METRIC RATING
179th/ 347
METRIC RANK
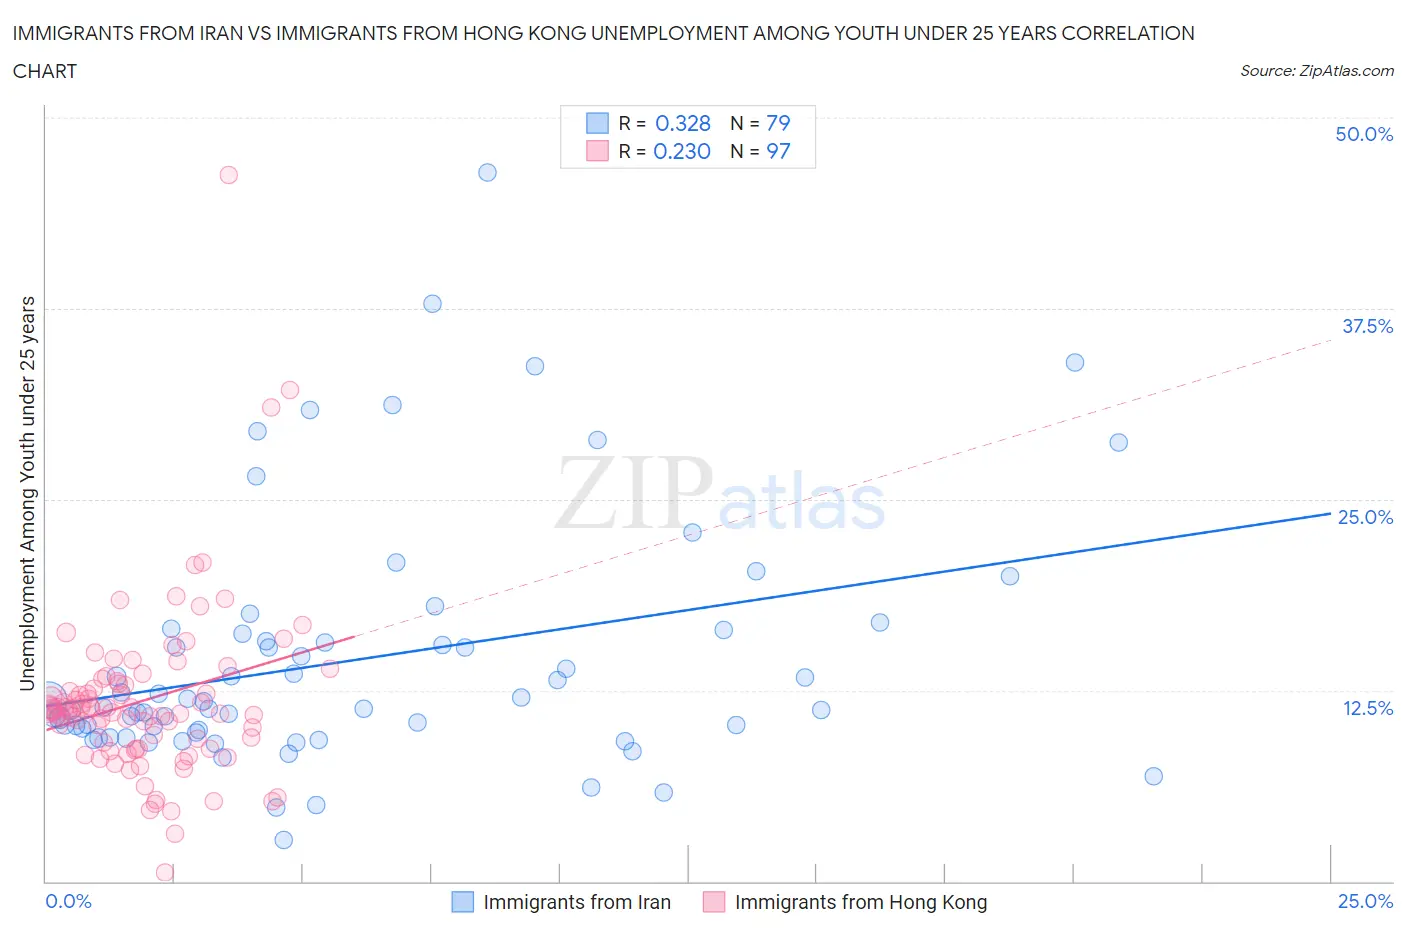
Immigrants from Iran vs Immigrants from Hong Kong Unemployment Among Youth under 25 years Correlation Chart
The statistical analysis conducted on geographies consisting of 277,951,490 people shows a mild positive correlation between the proportion of Immigrants from Iran and unemployment rate among youth under the age of 25 in the United States with a correlation coefficient (R) of 0.328 and weighted average of 12.0%. Similarly, the statistical analysis conducted on geographies consisting of 252,575,570 people shows a weak positive correlation between the proportion of Immigrants from Hong Kong and unemployment rate among youth under the age of 25 in the United States with a correlation coefficient (R) of 0.230 and weighted average of 11.6%, a difference of 3.4%.
Unemployment Among Youth under 25 years Correlation Summary
| Measurement | Immigrants from Iran | Immigrants from Hong Kong |
| Minimum | 2.7% | 0.60% |
| Maximum | 46.4% | 46.2% |
| Range | 43.7% | 45.6% |
| Mean | 14.5% | 11.8% |
| Median | 11.4% | 11.3% |
| Interquartile 25% (IQ1) | 9.8% | 8.7% |
| Interquartile 75% (IQ3) | 16.2% | 13.0% |
| Interquartile Range (IQR) | 6.5% | 4.3% |
| Standard Deviation (Sample) | 8.1% | 5.8% |
| Standard Deviation (Population) | 8.1% | 5.8% |
Similar Demographics by Unemployment Among Youth under 25 years
Demographics Similar to Immigrants from Iran by Unemployment Among Youth under 25 years
In terms of unemployment among youth under 25 years, the demographic groups most similar to Immigrants from Iran are Immigrants from Israel (12.0%, a difference of 0.020%), Immigrants from Ukraine (12.0%, a difference of 0.16%), Immigrants from Fiji (12.1%, a difference of 0.23%), Moroccan (12.1%, a difference of 0.24%), and Choctaw (12.1%, a difference of 0.29%).
| Demographics | Rating | Rank | Unemployment Among Youth under 25 years |
| Alsatians | 6.1 /100 | #220 | Tragic 11.9% |
| Immigrants | Portugal | 4.9 /100 | #221 | Tragic 12.0% |
| Israelis | 4.1 /100 | #222 | Tragic 12.0% |
| Immigrants | Ireland | 3.5 /100 | #223 | Tragic 12.0% |
| Hawaiians | 3.5 /100 | #224 | Tragic 12.0% |
| Immigrants | Ukraine | 3.0 /100 | #225 | Tragic 12.0% |
| Immigrants | Israel | 2.6 /100 | #226 | Tragic 12.0% |
| Immigrants | Iran | 2.6 /100 | #227 | Tragic 12.0% |
| Immigrants | Fiji | 2.1 /100 | #228 | Tragic 12.1% |
| Moroccans | 2.1 /100 | #229 | Tragic 12.1% |
| Choctaw | 1.9 /100 | #230 | Tragic 12.1% |
| Immigrants | South America | 1.8 /100 | #231 | Tragic 12.1% |
| Immigrants | Belarus | 1.6 /100 | #232 | Tragic 12.1% |
| South American Indians | 1.6 /100 | #233 | Tragic 12.1% |
| Guatemalans | 1.4 /100 | #234 | Tragic 12.1% |
Demographics Similar to Immigrants from Hong Kong by Unemployment Among Youth under 25 years
In terms of unemployment among youth under 25 years, the demographic groups most similar to Immigrants from Hong Kong are Immigrants from Europe (11.6%, a difference of 0.0%), Immigrants from Denmark (11.6%, a difference of 0.11%), Spaniard (11.7%, a difference of 0.11%), Ugandan (11.6%, a difference of 0.13%), and Syrian (11.7%, a difference of 0.17%).
| Demographics | Rating | Rank | Unemployment Among Youth under 25 years |
| Immigrants | Morocco | 55.1 /100 | #172 | Average 11.6% |
| Immigrants | South Eastern Asia | 51.7 /100 | #173 | Average 11.6% |
| Immigrants | China | 50.0 /100 | #174 | Average 11.6% |
| Immigrants | Iraq | 47.0 /100 | #175 | Average 11.6% |
| Ugandans | 45.6 /100 | #176 | Average 11.6% |
| Immigrants | Denmark | 45.0 /100 | #177 | Average 11.6% |
| Immigrants | Europe | 42.4 /100 | #178 | Average 11.6% |
| Immigrants | Hong Kong | 42.4 /100 | #179 | Average 11.6% |
| Spaniards | 39.8 /100 | #180 | Fair 11.7% |
| Syrians | 38.4 /100 | #181 | Fair 11.7% |
| Immigrants | Italy | 36.2 /100 | #182 | Fair 11.7% |
| Americans | 34.5 /100 | #183 | Fair 11.7% |
| Immigrants | Eastern Europe | 34.1 /100 | #184 | Fair 11.7% |
| French American Indians | 34.0 /100 | #185 | Fair 11.7% |
| Maltese | 33.9 /100 | #186 | Fair 11.7% |