Immigrants from Indonesia vs Immigrants from Yemen Unemployment Among Ages 55 to 59 years
COMPARE
Immigrants from Indonesia
Immigrants from Yemen
Unemployment Among Ages 55 to 59 years
Unemployment Among Ages 55 to 59 years Comparison
Immigrants from Indonesia
Immigrants from Yemen
4.8%
UNEMPLOYMENT AMONG AGES 55 TO 59 YEARS
80.2/ 100
METRIC RATING
140th/ 347
METRIC RANK
6.9%
UNEMPLOYMENT AMONG AGES 55 TO 59 YEARS
0.0/ 100
METRIC RATING
338th/ 347
METRIC RANK
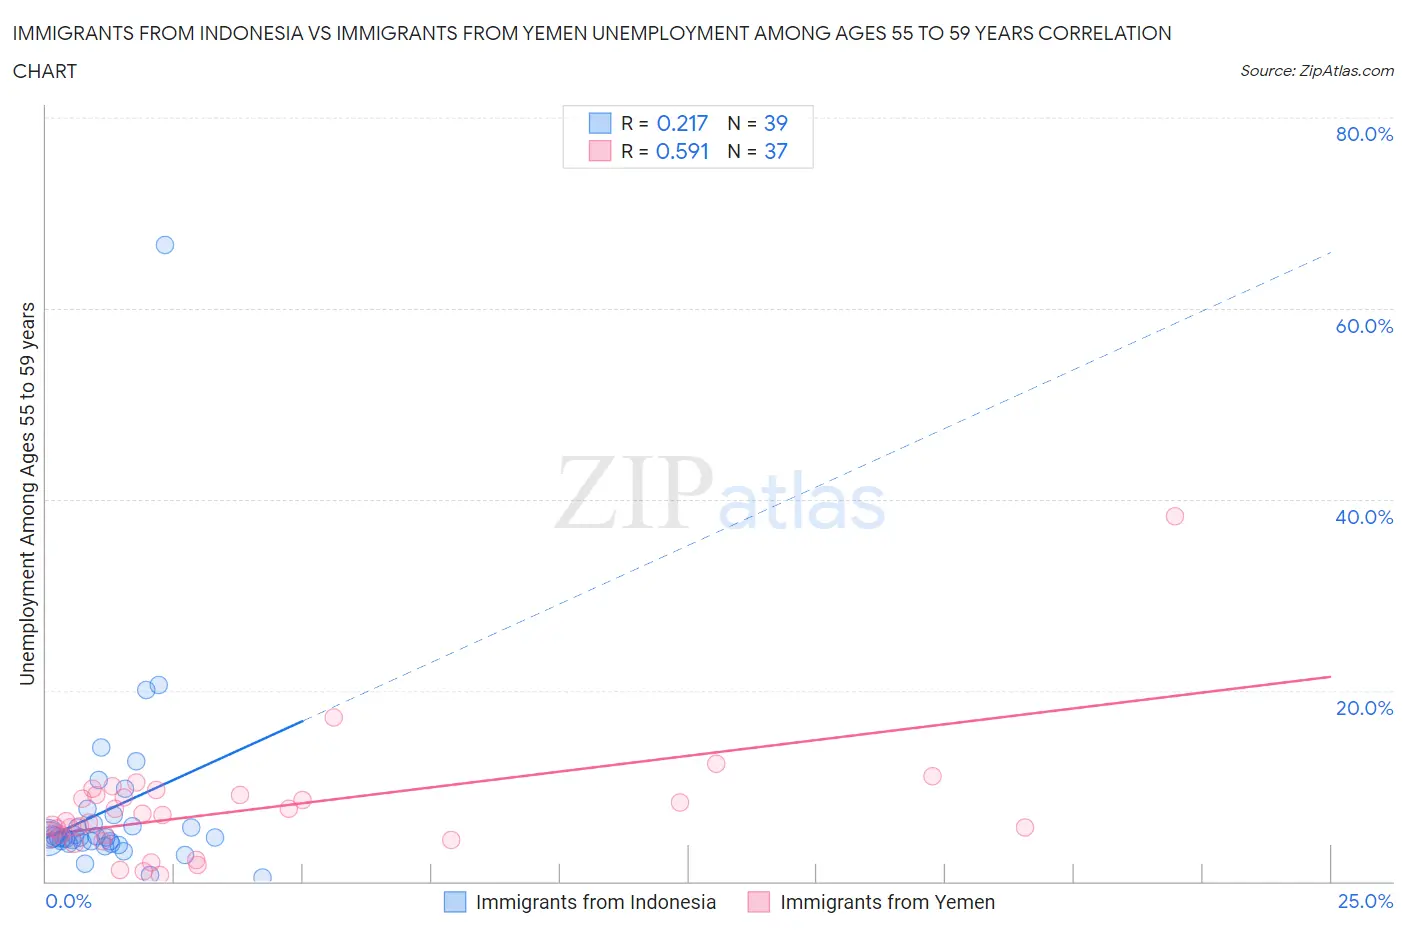
Immigrants from Indonesia vs Immigrants from Yemen Unemployment Among Ages 55 to 59 years Correlation Chart
The statistical analysis conducted on geographies consisting of 208,661,080 people shows a weak positive correlation between the proportion of Immigrants from Indonesia and unemployment rate among population between the ages 55 and 59 in the United States with a correlation coefficient (R) of 0.217 and weighted average of 4.8%. Similarly, the statistical analysis conducted on geographies consisting of 81,145,677 people shows a substantial positive correlation between the proportion of Immigrants from Yemen and unemployment rate among population between the ages 55 and 59 in the United States with a correlation coefficient (R) of 0.591 and weighted average of 6.9%, a difference of 45.0%.
Unemployment Among Ages 55 to 59 years Correlation Summary
| Measurement | Immigrants from Indonesia | Immigrants from Yemen |
| Minimum | 0.40% | 0.70% |
| Maximum | 66.7% | 38.2% |
| Range | 66.3% | 37.5% |
| Mean | 7.5% | 7.5% |
| Median | 4.6% | 6.3% |
| Interquartile 25% (IQ1) | 4.1% | 4.6% |
| Interquartile 75% (IQ3) | 6.0% | 9.0% |
| Interquartile Range (IQR) | 1.9% | 4.4% |
| Standard Deviation (Sample) | 10.6% | 6.2% |
| Standard Deviation (Population) | 10.5% | 6.1% |
Similar Demographics by Unemployment Among Ages 55 to 59 years
Demographics Similar to Immigrants from Indonesia by Unemployment Among Ages 55 to 59 years
In terms of unemployment among ages 55 to 59 years, the demographic groups most similar to Immigrants from Indonesia are French Canadian (4.8%, a difference of 0.010%), Immigrants from Norway (4.8%, a difference of 0.030%), Ukrainian (4.8%, a difference of 0.10%), Immigrants from Asia (4.8%, a difference of 0.15%), and Romanian (4.7%, a difference of 0.17%).
| Demographics | Rating | Rank | Unemployment Among Ages 55 to 59 years |
| Immigrants | Netherlands | 84.5 /100 | #133 | Excellent 4.7% |
| Panamanians | 84.1 /100 | #134 | Excellent 4.7% |
| Slavs | 83.7 /100 | #135 | Excellent 4.7% |
| Colombians | 83.6 /100 | #136 | Excellent 4.7% |
| Delaware | 83.6 /100 | #137 | Excellent 4.7% |
| Immigrants | Switzerland | 82.9 /100 | #138 | Excellent 4.7% |
| Romanians | 82.7 /100 | #139 | Excellent 4.7% |
| Immigrants | Indonesia | 80.2 /100 | #140 | Excellent 4.8% |
| French Canadians | 80.1 /100 | #141 | Excellent 4.8% |
| Immigrants | Norway | 79.8 /100 | #142 | Good 4.8% |
| Ukrainians | 78.6 /100 | #143 | Good 4.8% |
| Immigrants | Asia | 77.8 /100 | #144 | Good 4.8% |
| Immigrants | Northern Europe | 77.5 /100 | #145 | Good 4.8% |
| Immigrants | South Eastern Asia | 77.4 /100 | #146 | Good 4.8% |
| Immigrants | Singapore | 76.6 /100 | #147 | Good 4.8% |
Demographics Similar to Immigrants from Yemen by Unemployment Among Ages 55 to 59 years
In terms of unemployment among ages 55 to 59 years, the demographic groups most similar to Immigrants from Yemen are Puerto Rican (7.0%, a difference of 1.1%), Paiute (6.8%, a difference of 1.9%), Navajo (6.7%, a difference of 2.5%), Colville (6.7%, a difference of 2.6%), and Pueblo (6.7%, a difference of 2.8%).
| Demographics | Rating | Rank | Unemployment Among Ages 55 to 59 years |
| Immigrants | Dominican Republic | 0.0 /100 | #331 | Tragic 6.3% |
| Aleuts | 0.0 /100 | #332 | Tragic 6.4% |
| Pima | 0.0 /100 | #333 | Tragic 6.6% |
| Pueblo | 0.0 /100 | #334 | Tragic 6.7% |
| Colville | 0.0 /100 | #335 | Tragic 6.7% |
| Navajo | 0.0 /100 | #336 | Tragic 6.7% |
| Paiute | 0.0 /100 | #337 | Tragic 6.8% |
| Immigrants | Yemen | 0.0 /100 | #338 | Tragic 6.9% |
| Puerto Ricans | 0.0 /100 | #339 | Tragic 7.0% |
| Alaskan Athabascans | 0.0 /100 | #340 | Tragic 7.1% |
| Shoshone | 0.0 /100 | #341 | Tragic 7.4% |
| Hopi | 0.0 /100 | #342 | Tragic 8.1% |
| Yakama | 0.0 /100 | #343 | Tragic 8.9% |
| Inupiat | 0.0 /100 | #344 | Tragic 9.0% |
| Tohono O'odham | 0.0 /100 | #345 | Tragic 9.3% |