Immigrants from Indonesia vs Cuban Unemployment Among Ages 35 to 44 years
COMPARE
Immigrants from Indonesia
Cuban
Unemployment Among Ages 35 to 44 years
Unemployment Among Ages 35 to 44 years Comparison
Immigrants from Indonesia
Cubans
4.7%
UNEMPLOYMENT AMONG AGES 35 TO 44 YEARS
52.6/ 100
METRIC RATING
170th/ 347
METRIC RANK
4.2%
UNEMPLOYMENT AMONG AGES 35 TO 44 YEARS
99.8/ 100
METRIC RATING
16th/ 347
METRIC RANK
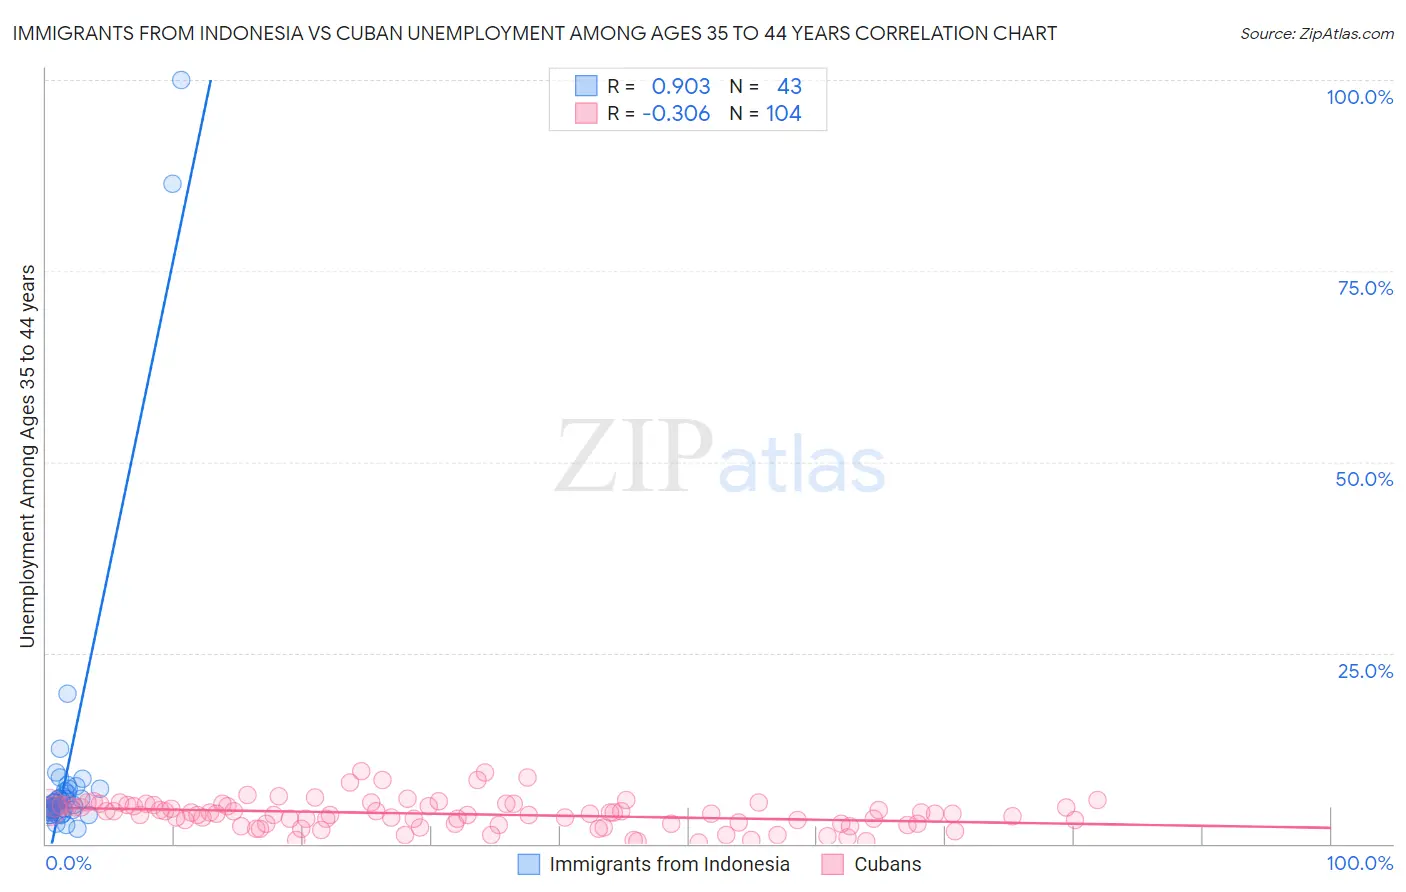
Immigrants from Indonesia vs Cuban Unemployment Among Ages 35 to 44 years Correlation Chart
The statistical analysis conducted on geographies consisting of 213,957,313 people shows a near-perfect positive correlation between the proportion of Immigrants from Indonesia and unemployment rate among population between the ages 35 and 44 in the United States with a correlation coefficient (R) of 0.903 and weighted average of 4.7%. Similarly, the statistical analysis conducted on geographies consisting of 436,966,387 people shows a mild negative correlation between the proportion of Cubans and unemployment rate among population between the ages 35 and 44 in the United States with a correlation coefficient (R) of -0.306 and weighted average of 4.2%, a difference of 11.9%.
Unemployment Among Ages 35 to 44 years Correlation Summary
| Measurement | Immigrants from Indonesia | Cuban |
| Minimum | 1.9% | 0.20% |
| Maximum | 100.0% | 9.5% |
| Range | 98.1% | 9.3% |
| Mean | 9.9% | 3.9% |
| Median | 5.3% | 3.9% |
| Interquartile 25% (IQ1) | 4.2% | 2.6% |
| Interquartile 75% (IQ3) | 7.1% | 5.0% |
| Interquartile Range (IQR) | 2.9% | 2.4% |
| Standard Deviation (Sample) | 18.9% | 1.9% |
| Standard Deviation (Population) | 18.7% | 1.9% |
Similar Demographics by Unemployment Among Ages 35 to 44 years
Demographics Similar to Immigrants from Indonesia by Unemployment Among Ages 35 to 44 years
In terms of unemployment among ages 35 to 44 years, the demographic groups most similar to Immigrants from Indonesia are Pennsylvania German (4.7%, a difference of 0.030%), Arab (4.7%, a difference of 0.040%), Indonesian (4.7%, a difference of 0.060%), Lebanese (4.7%, a difference of 0.090%), and Iraqi (4.7%, a difference of 0.12%).
| Demographics | Rating | Rank | Unemployment Among Ages 35 to 44 years |
| South Africans | 58.5 /100 | #163 | Average 4.7% |
| Immigrants | Morocco | 57.2 /100 | #164 | Average 4.7% |
| German Russians | 57.2 /100 | #165 | Average 4.7% |
| French | 55.6 /100 | #166 | Average 4.7% |
| Peruvians | 54.4 /100 | #167 | Average 4.7% |
| Arabs | 53.1 /100 | #168 | Average 4.7% |
| Pennsylvania Germans | 53.0 /100 | #169 | Average 4.7% |
| Immigrants | Indonesia | 52.6 /100 | #170 | Average 4.7% |
| Indonesians | 51.7 /100 | #171 | Average 4.7% |
| Lebanese | 51.4 /100 | #172 | Average 4.7% |
| Iraqis | 50.9 /100 | #173 | Average 4.7% |
| Afghans | 50.0 /100 | #174 | Average 4.7% |
| Immigrants | Germany | 48.9 /100 | #175 | Average 4.7% |
| Immigrants | Uganda | 48.1 /100 | #176 | Average 4.7% |
| Slovaks | 44.6 /100 | #177 | Average 4.7% |
Demographics Similar to Cubans by Unemployment Among Ages 35 to 44 years
In terms of unemployment among ages 35 to 44 years, the demographic groups most similar to Cubans are Swedish (4.2%, a difference of 0.010%), Latvian (4.2%, a difference of 0.020%), Immigrants from Nepal (4.2%, a difference of 0.29%), Immigrants from Bolivia (4.2%, a difference of 0.54%), and Tongan (4.2%, a difference of 0.77%).
| Demographics | Rating | Rank | Unemployment Among Ages 35 to 44 years |
| Danes | 99.9 /100 | #9 | Exceptional 4.1% |
| Immigrants | Singapore | 99.9 /100 | #10 | Exceptional 4.1% |
| Sudanese | 99.9 /100 | #11 | Exceptional 4.1% |
| Venezuelans | 99.9 /100 | #12 | Exceptional 4.1% |
| Bolivians | 99.9 /100 | #13 | Exceptional 4.1% |
| Czechs | 99.9 /100 | #14 | Exceptional 4.1% |
| Tongans | 99.8 /100 | #15 | Exceptional 4.2% |
| Cubans | 99.8 /100 | #16 | Exceptional 4.2% |
| Swedes | 99.8 /100 | #17 | Exceptional 4.2% |
| Latvians | 99.8 /100 | #18 | Exceptional 4.2% |
| Immigrants | Nepal | 99.7 /100 | #19 | Exceptional 4.2% |
| Immigrants | Bolivia | 99.7 /100 | #20 | Exceptional 4.2% |
| Paraguayans | 99.6 /100 | #21 | Exceptional 4.2% |
| Scandinavians | 99.5 /100 | #22 | Exceptional 4.2% |
| Immigrants | Kuwait | 99.5 /100 | #23 | Exceptional 4.3% |