Immigrants from Indonesia vs British West Indian Unemployment Among Women with Children Under 18 years
COMPARE
Immigrants from Indonesia
British West Indian
Unemployment Among Women with Children Under 18 years
Unemployment Among Women with Children Under 18 years Comparison
Immigrants from Indonesia
British West Indians
5.2%
UNEMPLOYMENT AMONG WOMEN WITH CHILDREN UNDER 18 YEARS
94.8/ 100
METRIC RATING
86th/ 347
METRIC RANK
6.6%
UNEMPLOYMENT AMONG WOMEN WITH CHILDREN UNDER 18 YEARS
0.0/ 100
METRIC RATING
314th/ 347
METRIC RANK
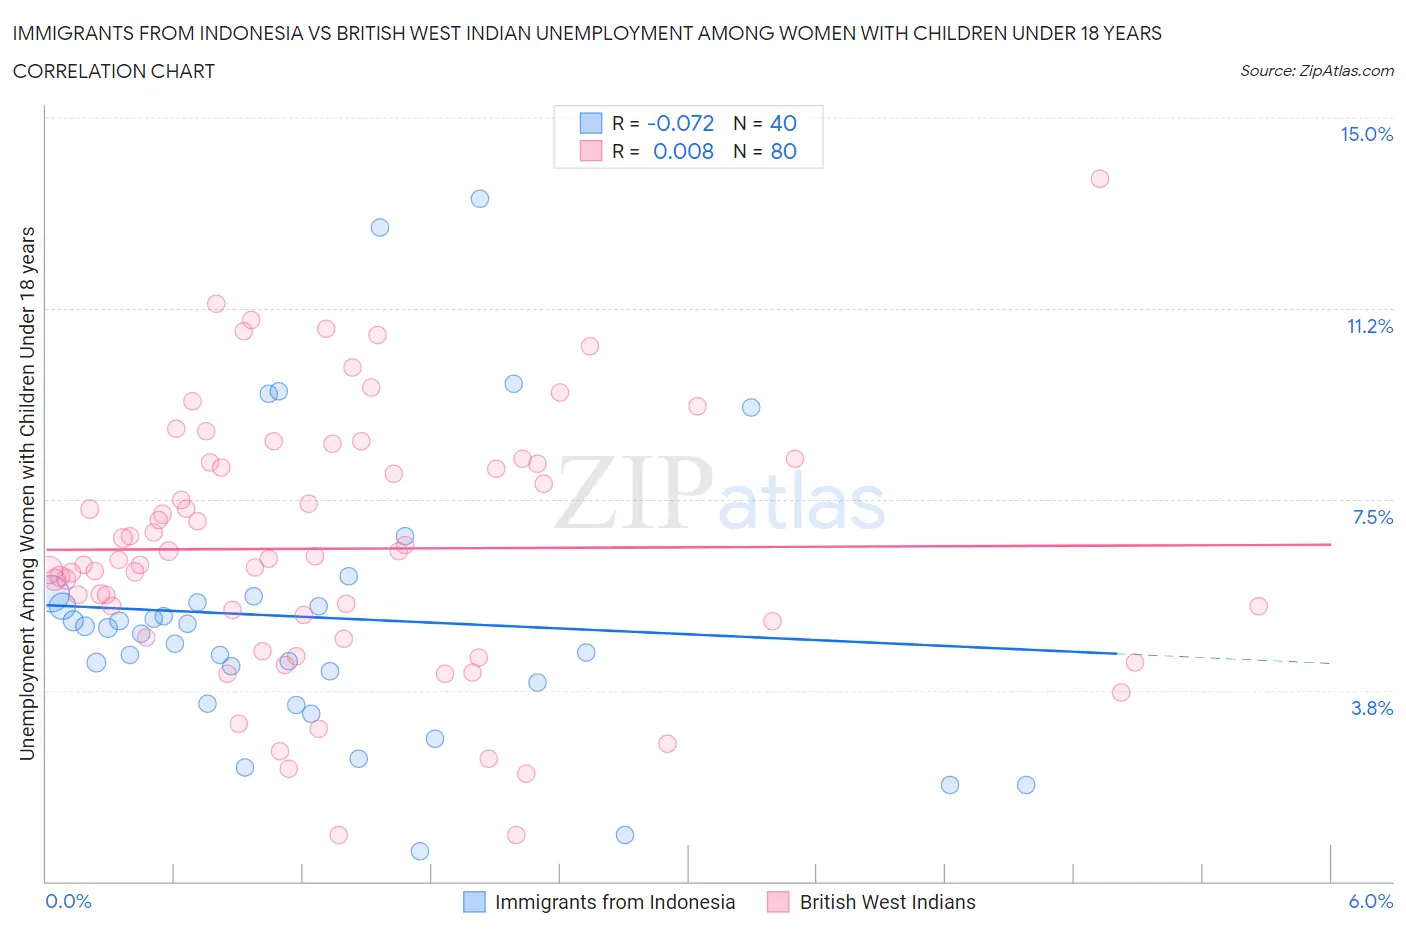
Immigrants from Indonesia vs British West Indian Unemployment Among Women with Children Under 18 years Correlation Chart
The statistical analysis conducted on geographies consisting of 212,131,457 people shows a slight negative correlation between the proportion of Immigrants from Indonesia and unemployment rate among women with children under the age of 18 in the United States with a correlation coefficient (R) of -0.072 and weighted average of 5.2%. Similarly, the statistical analysis conducted on geographies consisting of 150,735,674 people shows no correlation between the proportion of British West Indians and unemployment rate among women with children under the age of 18 in the United States with a correlation coefficient (R) of 0.008 and weighted average of 6.6%, a difference of 28.0%.
Unemployment Among Women with Children Under 18 years Correlation Summary
| Measurement | Immigrants from Indonesia | British West Indian |
| Minimum | 0.60% | 0.90% |
| Maximum | 13.4% | 13.8% |
| Range | 12.8% | 12.9% |
| Mean | 5.2% | 6.5% |
| Median | 4.9% | 6.3% |
| Interquartile 25% (IQ1) | 3.7% | 4.9% |
| Interquartile 75% (IQ3) | 5.5% | 8.2% |
| Interquartile Range (IQR) | 1.8% | 3.3% |
| Standard Deviation (Sample) | 2.8% | 2.5% |
| Standard Deviation (Population) | 2.8% | 2.5% |
Similar Demographics by Unemployment Among Women with Children Under 18 years
Demographics Similar to Immigrants from Indonesia by Unemployment Among Women with Children Under 18 years
In terms of unemployment among women with children under 18 years, the demographic groups most similar to Immigrants from Indonesia are Paraguayan (5.2%, a difference of 0.010%), Laotian (5.2%, a difference of 0.030%), Immigrants from Scotland (5.2%, a difference of 0.10%), Australian (5.2%, a difference of 0.12%), and Maltese (5.2%, a difference of 0.13%).
| Demographics | Rating | Rank | Unemployment Among Women with Children Under 18 years |
| Immigrants | Croatia | 95.6 /100 | #79 | Exceptional 5.1% |
| Bolivians | 95.5 /100 | #80 | Exceptional 5.1% |
| Immigrants | Lithuania | 95.4 /100 | #81 | Exceptional 5.2% |
| Romanians | 95.3 /100 | #82 | Exceptional 5.2% |
| Maltese | 95.1 /100 | #83 | Exceptional 5.2% |
| Australians | 95.1 /100 | #84 | Exceptional 5.2% |
| Paraguayans | 94.8 /100 | #85 | Exceptional 5.2% |
| Immigrants | Indonesia | 94.8 /100 | #86 | Exceptional 5.2% |
| Laotians | 94.7 /100 | #87 | Exceptional 5.2% |
| Immigrants | Scotland | 94.5 /100 | #88 | Exceptional 5.2% |
| Immigrants | Turkey | 94.2 /100 | #89 | Exceptional 5.2% |
| Ukrainians | 93.8 /100 | #90 | Exceptional 5.2% |
| Immigrants | Zimbabwe | 93.6 /100 | #91 | Exceptional 5.2% |
| Immigrants | Pakistan | 93.3 /100 | #92 | Exceptional 5.2% |
| Immigrants | Canada | 93.3 /100 | #93 | Exceptional 5.2% |
Demographics Similar to British West Indians by Unemployment Among Women with Children Under 18 years
In terms of unemployment among women with children under 18 years, the demographic groups most similar to British West Indians are Immigrants from West Indies (6.6%, a difference of 0.0%), Hispanic or Latino (6.6%, a difference of 0.14%), Immigrants from Ecuador (6.6%, a difference of 0.34%), Shoshone (6.6%, a difference of 0.38%), and Immigrants from Mexico (6.6%, a difference of 0.43%).
| Demographics | Rating | Rank | Unemployment Among Women with Children Under 18 years |
| Belizeans | 0.0 /100 | #307 | Tragic 6.5% |
| Africans | 0.0 /100 | #308 | Tragic 6.5% |
| Ecuadorians | 0.0 /100 | #309 | Tragic 6.5% |
| Guyanese | 0.0 /100 | #310 | Tragic 6.6% |
| Yaqui | 0.0 /100 | #311 | Tragic 6.6% |
| Immigrants | Mexico | 0.0 /100 | #312 | Tragic 6.6% |
| Hispanics or Latinos | 0.0 /100 | #313 | Tragic 6.6% |
| British West Indians | 0.0 /100 | #314 | Tragic 6.6% |
| Immigrants | West Indies | 0.0 /100 | #315 | Tragic 6.6% |
| Immigrants | Ecuador | 0.0 /100 | #316 | Tragic 6.6% |
| Shoshone | 0.0 /100 | #317 | Tragic 6.6% |
| Alaska Natives | 0.0 /100 | #318 | Tragic 6.7% |
| Central American Indians | 0.0 /100 | #319 | Tragic 6.7% |
| Immigrants | Belize | 0.0 /100 | #320 | Tragic 6.7% |
| U.S. Virgin Islanders | 0.0 /100 | #321 | Tragic 6.7% |