Immigrants from India vs Sierra Leonean Unemployment Among Ages 55 to 59 years
COMPARE
Immigrants from India
Sierra Leonean
Unemployment Among Ages 55 to 59 years
Unemployment Among Ages 55 to 59 years Comparison
Immigrants from India
Sierra Leoneans
4.3%
UNEMPLOYMENT AMONG AGES 55 TO 59 YEARS
100.0/ 100
METRIC RATING
14th/ 347
METRIC RANK
5.5%
UNEMPLOYMENT AMONG AGES 55 TO 59 YEARS
0.0/ 100
METRIC RATING
302nd/ 347
METRIC RANK
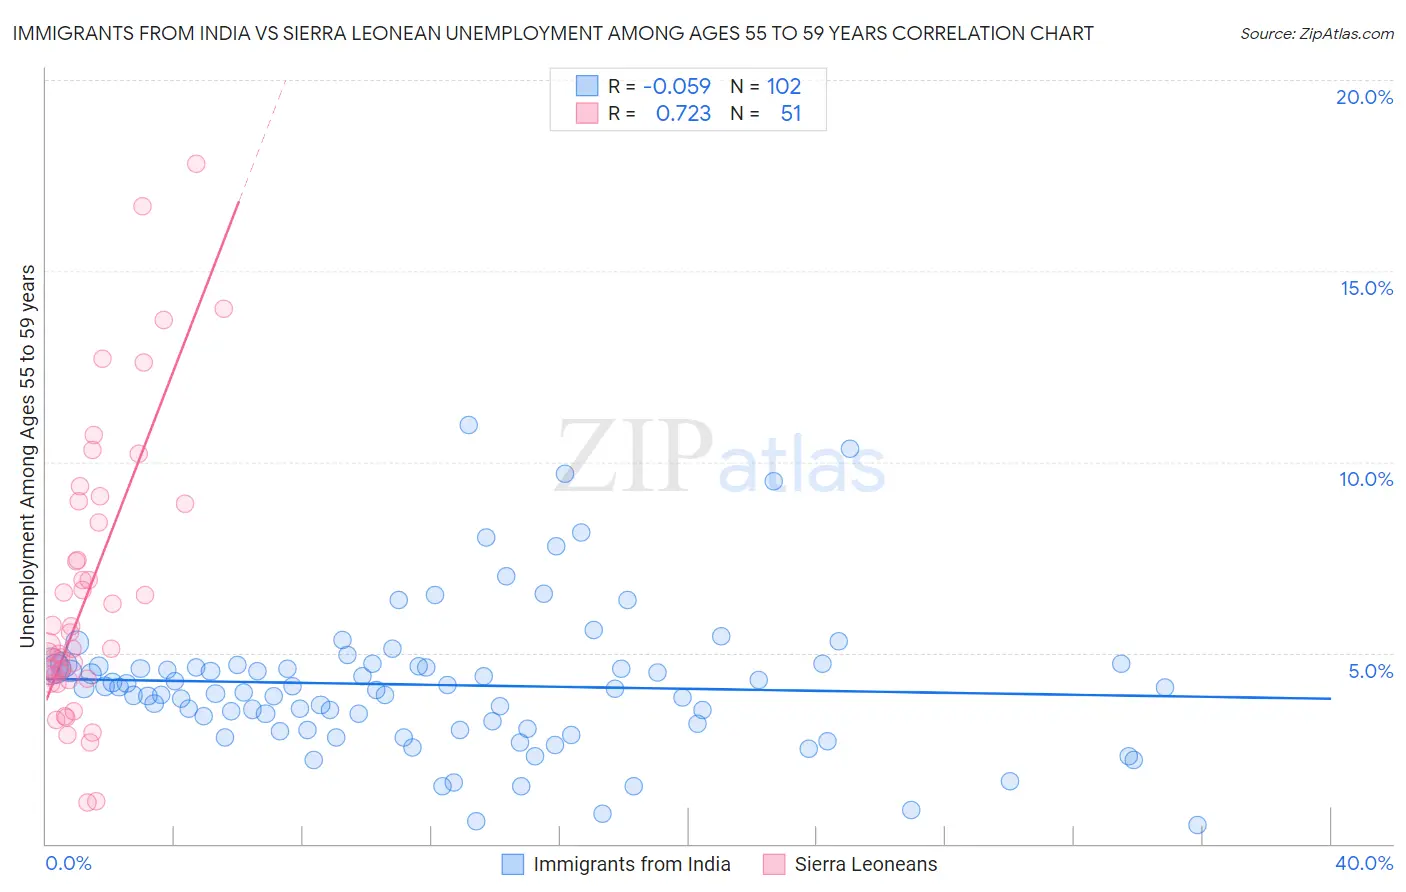
Immigrants from India vs Sierra Leonean Unemployment Among Ages 55 to 59 years Correlation Chart
The statistical analysis conducted on geographies consisting of 401,664,281 people shows a slight negative correlation between the proportion of Immigrants from India and unemployment rate among population between the ages 55 and 59 in the United States with a correlation coefficient (R) of -0.059 and weighted average of 4.3%. Similarly, the statistical analysis conducted on geographies consisting of 81,855,040 people shows a strong positive correlation between the proportion of Sierra Leoneans and unemployment rate among population between the ages 55 and 59 in the United States with a correlation coefficient (R) of 0.723 and weighted average of 5.5%, a difference of 26.3%.
Unemployment Among Ages 55 to 59 years Correlation Summary
| Measurement | Immigrants from India | Sierra Leonean |
| Minimum | 0.50% | 1.1% |
| Maximum | 11.0% | 17.8% |
| Range | 10.5% | 16.7% |
| Mean | 4.2% | 6.6% |
| Median | 4.1% | 5.2% |
| Interquartile 25% (IQ1) | 3.0% | 4.3% |
| Interquartile 75% (IQ3) | 4.7% | 8.9% |
| Interquartile Range (IQR) | 1.7% | 4.6% |
| Standard Deviation (Sample) | 1.9% | 3.7% |
| Standard Deviation (Population) | 1.9% | 3.7% |
Similar Demographics by Unemployment Among Ages 55 to 59 years
Demographics Similar to Immigrants from India by Unemployment Among Ages 55 to 59 years
In terms of unemployment among ages 55 to 59 years, the demographic groups most similar to Immigrants from India are Indonesian (4.3%, a difference of 0.16%), Bulgarian (4.3%, a difference of 0.26%), Danish (4.3%, a difference of 0.41%), Somali (4.4%, a difference of 0.49%), and Immigrants from Congo (4.3%, a difference of 0.61%).
| Demographics | Rating | Rank | Unemployment Among Ages 55 to 59 years |
| Zimbabweans | 100.0 /100 | #7 | Exceptional 4.2% |
| Bolivians | 100.0 /100 | #8 | Exceptional 4.2% |
| Cubans | 100.0 /100 | #9 | Exceptional 4.2% |
| Tongans | 100.0 /100 | #10 | Exceptional 4.3% |
| Immigrants | Congo | 100.0 /100 | #11 | Exceptional 4.3% |
| Danes | 100.0 /100 | #12 | Exceptional 4.3% |
| Indonesians | 100.0 /100 | #13 | Exceptional 4.3% |
| Immigrants | India | 100.0 /100 | #14 | Exceptional 4.3% |
| Bulgarians | 100.0 /100 | #15 | Exceptional 4.3% |
| Somalis | 100.0 /100 | #16 | Exceptional 4.4% |
| Czechs | 100.0 /100 | #17 | Exceptional 4.4% |
| Immigrants | Somalia | 100.0 /100 | #18 | Exceptional 4.4% |
| Chinese | 100.0 /100 | #19 | Exceptional 4.4% |
| Swedes | 100.0 /100 | #20 | Exceptional 4.4% |
| Puget Sound Salish | 100.0 /100 | #21 | Exceptional 4.4% |
Demographics Similar to Sierra Leoneans by Unemployment Among Ages 55 to 59 years
In terms of unemployment among ages 55 to 59 years, the demographic groups most similar to Sierra Leoneans are Marshallese (5.5%, a difference of 0.010%), Immigrants from Dominica (5.5%, a difference of 0.40%), Black/African American (5.5%, a difference of 0.53%), Immigrants from St. Vincent and the Grenadines (5.4%, a difference of 0.64%), and Immigrants from Portugal (5.5%, a difference of 0.70%).
| Demographics | Rating | Rank | Unemployment Among Ages 55 to 59 years |
| Dutch West Indians | 0.0 /100 | #295 | Tragic 5.3% |
| Barbadians | 0.0 /100 | #296 | Tragic 5.3% |
| Immigrants | Mexico | 0.0 /100 | #297 | Tragic 5.3% |
| Hispanics or Latinos | 0.0 /100 | #298 | Tragic 5.4% |
| Cape Verdeans | 0.0 /100 | #299 | Tragic 5.4% |
| Immigrants | St. Vincent and the Grenadines | 0.0 /100 | #300 | Tragic 5.4% |
| Immigrants | Dominica | 0.0 /100 | #301 | Tragic 5.5% |
| Sierra Leoneans | 0.0 /100 | #302 | Tragic 5.5% |
| Marshallese | 0.0 /100 | #303 | Tragic 5.5% |
| Blacks/African Americans | 0.0 /100 | #304 | Tragic 5.5% |
| Immigrants | Portugal | 0.0 /100 | #305 | Tragic 5.5% |
| Immigrants | Cabo Verde | 0.0 /100 | #306 | Tragic 5.5% |
| Immigrants | Belize | 0.0 /100 | #307 | Tragic 5.5% |
| Spanish American Indians | 0.0 /100 | #308 | Tragic 5.6% |
| Nepalese | 0.0 /100 | #309 | Tragic 5.6% |