Immigrants from India vs Laotian Male Unemployment
COMPARE
Immigrants from India
Laotian
Male Unemployment
Male Unemployment Comparison
Immigrants from India
Laotians
4.4%
MALE UNEMPLOYMENT
100.0/ 100
METRIC RATING
1st/ 347
METRIC RANK
5.2%
MALE UNEMPLOYMENT
73.8/ 100
METRIC RATING
154th/ 347
METRIC RANK
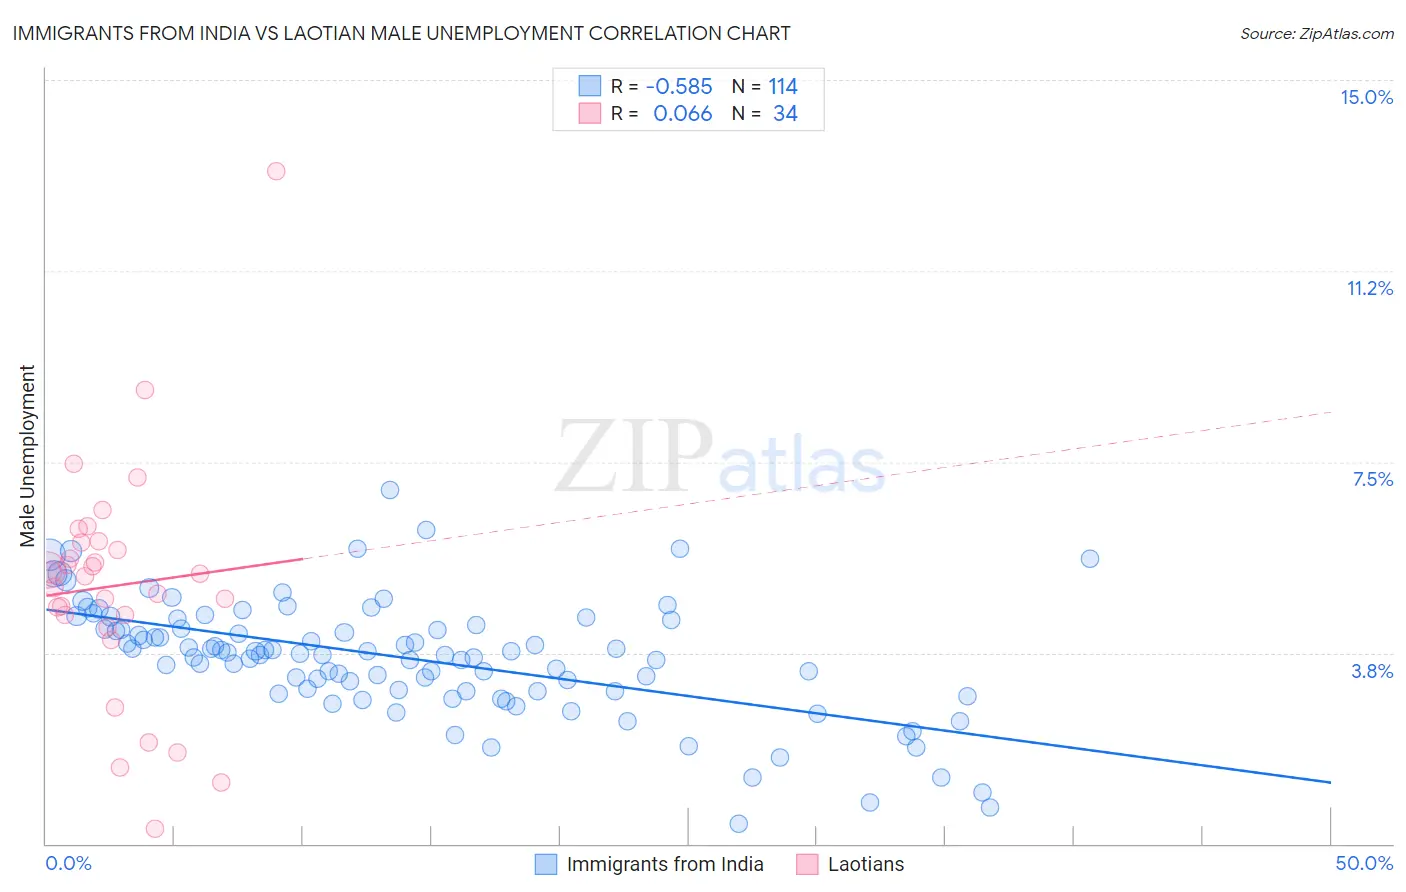
Immigrants from India vs Laotian Male Unemployment Correlation Chart
The statistical analysis conducted on geographies consisting of 432,248,536 people shows a substantial negative correlation between the proportion of Immigrants from India and unemployment rate among males in the United States with a correlation coefficient (R) of -0.585 and weighted average of 4.4%. Similarly, the statistical analysis conducted on geographies consisting of 224,510,892 people shows a slight positive correlation between the proportion of Laotians and unemployment rate among males in the United States with a correlation coefficient (R) of 0.066 and weighted average of 5.2%, a difference of 19.2%.
Male Unemployment Correlation Summary
| Measurement | Immigrants from India | Laotian |
| Minimum | 0.40% | 0.30% |
| Maximum | 7.0% | 13.2% |
| Range | 6.6% | 12.9% |
| Mean | 3.6% | 5.1% |
| Median | 3.7% | 5.3% |
| Interquartile 25% (IQ1) | 3.0% | 4.5% |
| Interquartile 75% (IQ3) | 4.3% | 5.9% |
| Interquartile Range (IQR) | 1.3% | 1.4% |
| Standard Deviation (Sample) | 1.1% | 2.3% |
| Standard Deviation (Population) | 1.1% | 2.3% |
Similar Demographics by Male Unemployment
Demographics Similar to Immigrants from India by Male Unemployment
In terms of male unemployment, the demographic groups most similar to Immigrants from India are Immigrants from Cuba (4.4%, a difference of 1.1%), Norwegian (4.4%, a difference of 1.3%), Immigrants from Venezuela (4.4%, a difference of 1.7%), Danish (4.5%, a difference of 2.8%), and Venezuelan (4.5%, a difference of 3.2%).
| Demographics | Rating | Rank | Male Unemployment |
| Immigrants | India | 100.0 /100 | #1 | Exceptional 4.4% |
| Immigrants | Cuba | 100.0 /100 | #2 | Exceptional 4.4% |
| Norwegians | 100.0 /100 | #3 | Exceptional 4.4% |
| Immigrants | Venezuela | 100.0 /100 | #4 | Exceptional 4.4% |
| Danes | 100.0 /100 | #5 | Exceptional 4.5% |
| Venezuelans | 100.0 /100 | #6 | Exceptional 4.5% |
| Czechs | 100.0 /100 | #7 | Exceptional 4.5% |
| Luxembourgers | 100.0 /100 | #8 | Exceptional 4.5% |
| Thais | 100.0 /100 | #9 | Exceptional 4.6% |
| Cubans | 100.0 /100 | #10 | Exceptional 4.6% |
| Swedes | 100.0 /100 | #11 | Exceptional 4.6% |
| Immigrants | Bolivia | 100.0 /100 | #12 | Exceptional 4.7% |
| Bolivians | 100.0 /100 | #13 | Exceptional 4.7% |
| Germans | 100.0 /100 | #14 | Exceptional 4.7% |
| Scandinavians | 100.0 /100 | #15 | Exceptional 4.7% |
Demographics Similar to Laotians by Male Unemployment
In terms of male unemployment, the demographic groups most similar to Laotians are Immigrants from Uruguay (5.2%, a difference of 0.010%), Immigrants from Hungary (5.2%, a difference of 0.030%), Egyptian (5.2%, a difference of 0.080%), American (5.2%, a difference of 0.090%), and Immigrants from Northern Africa (5.2%, a difference of 0.12%).
| Demographics | Rating | Rank | Male Unemployment |
| Immigrants | Burma/Myanmar | 77.5 /100 | #147 | Good 5.2% |
| Immigrants | Italy | 76.3 /100 | #148 | Good 5.2% |
| Immigrants | Europe | 76.2 /100 | #149 | Good 5.2% |
| Indians (Asian) | 76.0 /100 | #150 | Good 5.2% |
| Slovaks | 75.5 /100 | #151 | Good 5.2% |
| Egyptians | 74.8 /100 | #152 | Good 5.2% |
| Immigrants | Uruguay | 73.9 /100 | #153 | Good 5.2% |
| Laotians | 73.8 /100 | #154 | Good 5.2% |
| Immigrants | Hungary | 73.4 /100 | #155 | Good 5.2% |
| Americans | 72.7 /100 | #156 | Good 5.2% |
| Immigrants | Northern Africa | 72.3 /100 | #157 | Good 5.2% |
| Immigrants | Indonesia | 71.5 /100 | #158 | Good 5.2% |
| Indonesians | 71.2 /100 | #159 | Good 5.2% |
| Immigrants | Norway | 71.0 /100 | #160 | Good 5.2% |
| Immigrants | China | 70.6 /100 | #161 | Good 5.2% |