Immigrants from Hungary vs Welsh Unemployment Among Ages 16 to 19 years
COMPARE
Immigrants from Hungary
Welsh
Unemployment Among Ages 16 to 19 years
Unemployment Among Ages 16 to 19 years Comparison
Immigrants from Hungary
Welsh
17.5%
UNEMPLOYMENT AMONG AGES 16 TO 19 YEARS
54.7/ 100
METRIC RATING
168th/ 347
METRIC RANK
16.4%
UNEMPLOYMENT AMONG AGES 16 TO 19 YEARS
99.6/ 100
METRIC RATING
52nd/ 347
METRIC RANK
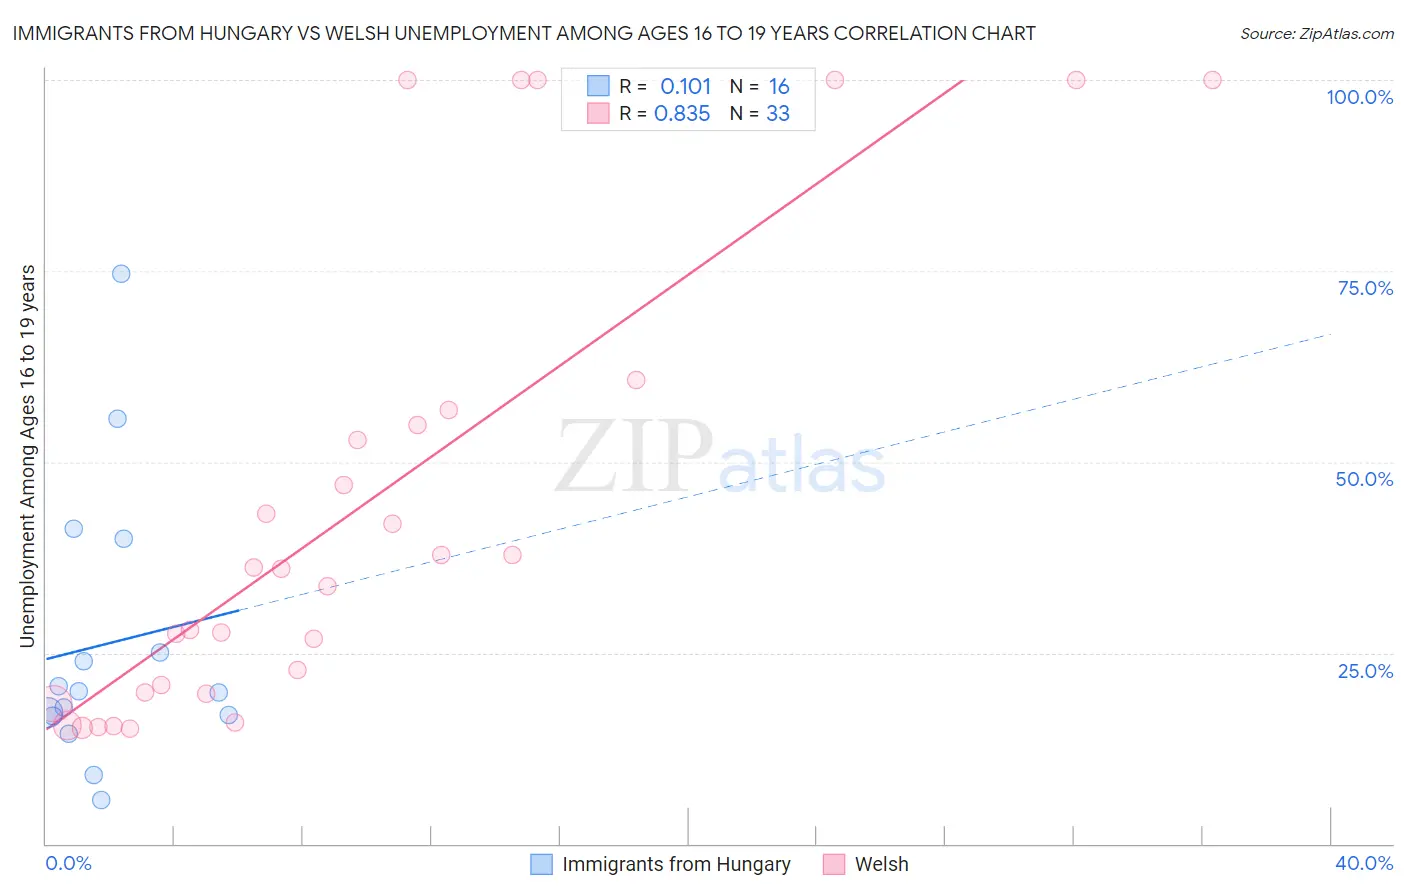
Immigrants from Hungary vs Welsh Unemployment Among Ages 16 to 19 years Correlation Chart
The statistical analysis conducted on geographies consisting of 188,748,138 people shows a poor positive correlation between the proportion of Immigrants from Hungary and unemployment rate among population between the ages 16 and 19 in the United States with a correlation coefficient (R) of 0.101 and weighted average of 17.5%. Similarly, the statistical analysis conducted on geographies consisting of 478,657,632 people shows a very strong positive correlation between the proportion of Welsh and unemployment rate among population between the ages 16 and 19 in the United States with a correlation coefficient (R) of 0.835 and weighted average of 16.4%, a difference of 6.7%.
Unemployment Among Ages 16 to 19 years Correlation Summary
| Measurement | Immigrants from Hungary | Welsh |
| Minimum | 5.8% | 15.0% |
| Maximum | 74.6% | 100.0% |
| Range | 68.8% | 85.0% |
| Mean | 26.1% | 43.7% |
| Median | 19.9% | 36.0% |
| Interquartile 25% (IQ1) | 16.8% | 19.7% |
| Interquartile 75% (IQ3) | 32.5% | 55.8% |
| Interquartile Range (IQR) | 15.7% | 36.1% |
| Standard Deviation (Sample) | 18.1% | 29.9% |
| Standard Deviation (Population) | 17.6% | 29.4% |
Similar Demographics by Unemployment Among Ages 16 to 19 years
Demographics Similar to Immigrants from Hungary by Unemployment Among Ages 16 to 19 years
In terms of unemployment among ages 16 to 19 years, the demographic groups most similar to Immigrants from Hungary are Immigrants from France (17.5%, a difference of 0.010%), Immigrants from Cambodia (17.5%, a difference of 0.010%), Immigrants from Italy (17.5%, a difference of 0.020%), Cape Verdean (17.5%, a difference of 0.050%), and Immigrants from Romania (17.5%, a difference of 0.070%).
| Demographics | Rating | Rank | Unemployment Among Ages 16 to 19 years |
| Immigrants | Denmark | 60.3 /100 | #161 | Good 17.5% |
| Immigrants | Norway | 59.8 /100 | #162 | Average 17.5% |
| Egyptians | 59.7 /100 | #163 | Average 17.5% |
| Immigrants | Austria | 57.7 /100 | #164 | Average 17.5% |
| Cape Verdeans | 55.8 /100 | #165 | Average 17.5% |
| Immigrants | Italy | 55.2 /100 | #166 | Average 17.5% |
| Immigrants | France | 54.9 /100 | #167 | Average 17.5% |
| Immigrants | Hungary | 54.7 /100 | #168 | Average 17.5% |
| Immigrants | Cambodia | 54.5 /100 | #169 | Average 17.5% |
| Immigrants | Romania | 53.3 /100 | #170 | Average 17.5% |
| Immigrants | Switzerland | 53.2 /100 | #171 | Average 17.5% |
| Immigrants | Western Europe | 52.2 /100 | #172 | Average 17.6% |
| Chileans | 50.8 /100 | #173 | Average 17.6% |
| Osage | 50.0 /100 | #174 | Average 17.6% |
| Immigrants | Sweden | 49.1 /100 | #175 | Average 17.6% |
Demographics Similar to Welsh by Unemployment Among Ages 16 to 19 years
In terms of unemployment among ages 16 to 19 years, the demographic groups most similar to Welsh are Lebanese (16.4%, a difference of 0.030%), Slovene (16.4%, a difference of 0.080%), Bhutanese (16.4%, a difference of 0.14%), British (16.5%, a difference of 0.14%), and Czechoslovakian (16.5%, a difference of 0.16%).
| Demographics | Rating | Rank | Unemployment Among Ages 16 to 19 years |
| Poles | 99.7 /100 | #45 | Exceptional 16.4% |
| Immigrants | North Macedonia | 99.7 /100 | #46 | Exceptional 16.4% |
| Immigrants | Vietnam | 99.7 /100 | #47 | Exceptional 16.4% |
| Maltese | 99.7 /100 | #48 | Exceptional 16.4% |
| Iraqis | 99.7 /100 | #49 | Exceptional 16.4% |
| Bhutanese | 99.6 /100 | #50 | Exceptional 16.4% |
| Lebanese | 99.6 /100 | #51 | Exceptional 16.4% |
| Welsh | 99.6 /100 | #52 | Exceptional 16.4% |
| Slovenes | 99.6 /100 | #53 | Exceptional 16.4% |
| British | 99.5 /100 | #54 | Exceptional 16.5% |
| Czechoslovakians | 99.5 /100 | #55 | Exceptional 16.5% |
| Sri Lankans | 99.5 /100 | #56 | Exceptional 16.5% |
| Immigrants | Jordan | 99.4 /100 | #57 | Exceptional 16.5% |
| Immigrants | Uganda | 99.4 /100 | #58 | Exceptional 16.5% |
| Irish | 99.4 /100 | #59 | Exceptional 16.5% |