Immigrants from Hungary vs Japanese Unemployment Among Women with Children Under 6 years
COMPARE
Immigrants from Hungary
Japanese
Unemployment Among Women with Children Under 6 years
Unemployment Among Women with Children Under 6 years Comparison
Immigrants from Hungary
Japanese
7.1%
UNEMPLOYMENT AMONG WOMEN WITH CHILDREN UNDER 6 YEARS
98.3/ 100
METRIC RATING
88th/ 347
METRIC RANK
7.5%
UNEMPLOYMENT AMONG WOMEN WITH CHILDREN UNDER 6 YEARS
78.9/ 100
METRIC RATING
146th/ 347
METRIC RANK
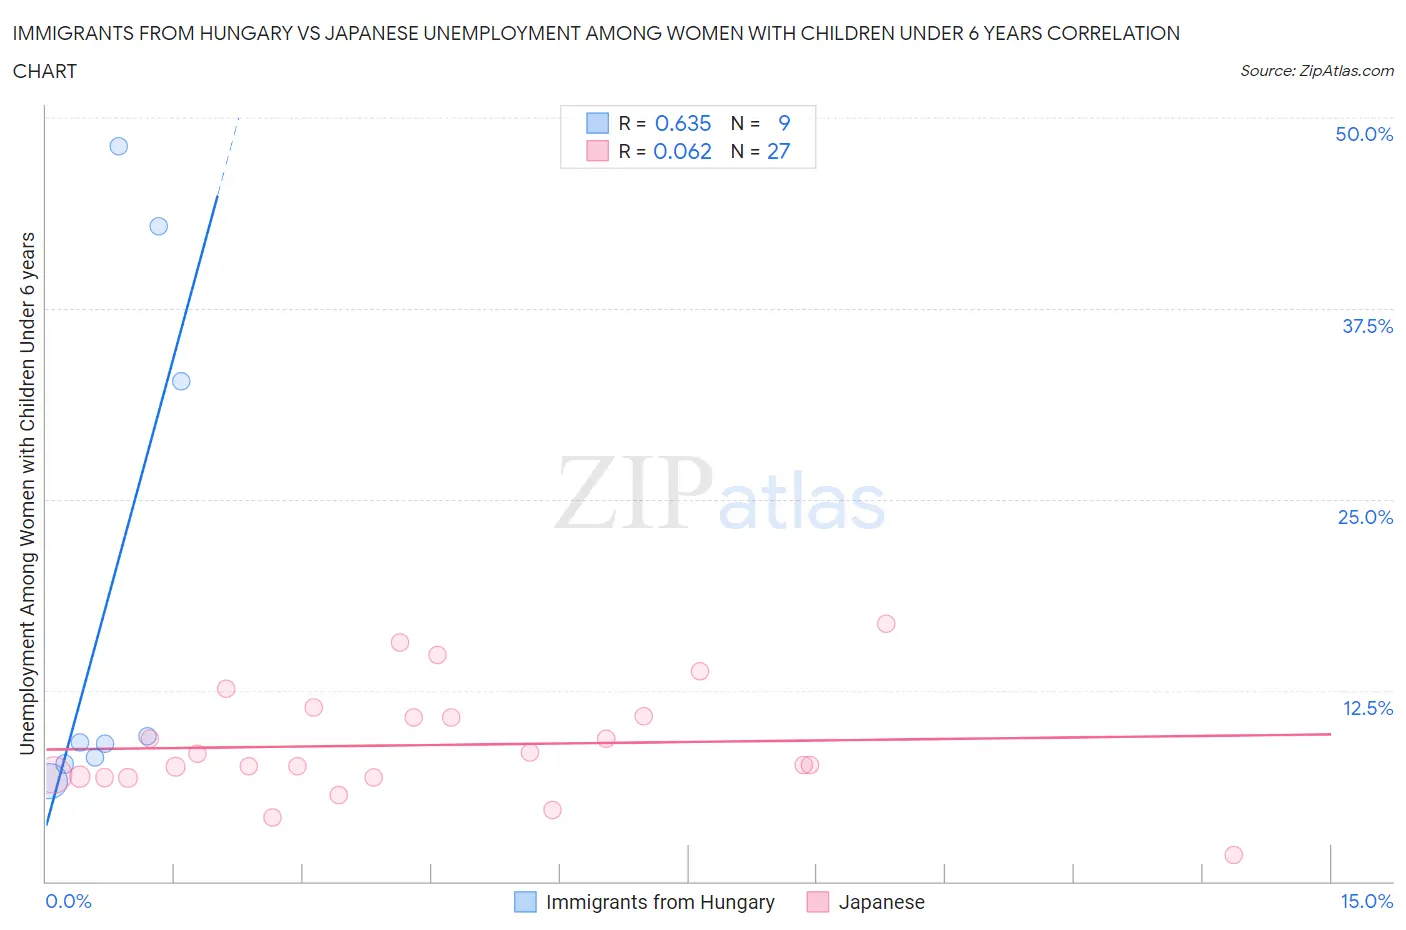
Immigrants from Hungary vs Japanese Unemployment Among Women with Children Under 6 years Correlation Chart
The statistical analysis conducted on geographies consisting of 163,263,392 people shows a significant positive correlation between the proportion of Immigrants from Hungary and unemployment rate among women with children under the age of 6 in the United States with a correlation coefficient (R) of 0.635 and weighted average of 7.1%. Similarly, the statistical analysis conducted on geographies consisting of 210,271,633 people shows a slight positive correlation between the proportion of Japanese and unemployment rate among women with children under the age of 6 in the United States with a correlation coefficient (R) of 0.062 and weighted average of 7.5%, a difference of 4.9%.
Unemployment Among Women with Children Under 6 years Correlation Summary
| Measurement | Immigrants from Hungary | Japanese |
| Minimum | 6.5% | 1.7% |
| Maximum | 48.1% | 16.9% |
| Range | 41.6% | 15.2% |
| Mean | 19.3% | 8.9% |
| Median | 9.1% | 7.6% |
| Interquartile 25% (IQ1) | 7.9% | 6.8% |
| Interquartile 75% (IQ3) | 37.8% | 10.8% |
| Interquartile Range (IQR) | 29.9% | 4.0% |
| Standard Deviation (Sample) | 16.9% | 3.6% |
| Standard Deviation (Population) | 16.0% | 3.5% |
Similar Demographics by Unemployment Among Women with Children Under 6 years
Demographics Similar to Immigrants from Hungary by Unemployment Among Women with Children Under 6 years
In terms of unemployment among women with children under 6 years, the demographic groups most similar to Immigrants from Hungary are Immigrants from Denmark (7.1%, a difference of 0.040%), Immigrants from Spain (7.1%, a difference of 0.090%), Alsatian (7.1%, a difference of 0.12%), Danish (7.1%, a difference of 0.16%), and Immigrants from Zimbabwe (7.1%, a difference of 0.28%).
| Demographics | Rating | Rank | Unemployment Among Women with Children Under 6 years |
| Immigrants | Venezuela | 98.8 /100 | #81 | Exceptional 7.1% |
| Immigrants | Afghanistan | 98.7 /100 | #82 | Exceptional 7.1% |
| Egyptians | 98.7 /100 | #83 | Exceptional 7.1% |
| Immigrants | Albania | 98.7 /100 | #84 | Exceptional 7.1% |
| Immigrants | Romania | 98.7 /100 | #85 | Exceptional 7.1% |
| Immigrants | Zimbabwe | 98.6 /100 | #86 | Exceptional 7.1% |
| Alsatians | 98.4 /100 | #87 | Exceptional 7.1% |
| Immigrants | Hungary | 98.3 /100 | #88 | Exceptional 7.1% |
| Immigrants | Denmark | 98.3 /100 | #89 | Exceptional 7.1% |
| Immigrants | Spain | 98.2 /100 | #90 | Exceptional 7.1% |
| Danes | 98.2 /100 | #91 | Exceptional 7.1% |
| Albanians | 98.0 /100 | #92 | Exceptional 7.2% |
| New Zealanders | 97.8 /100 | #93 | Exceptional 7.2% |
| Macedonians | 97.7 /100 | #94 | Exceptional 7.2% |
| Romanians | 97.7 /100 | #95 | Exceptional 7.2% |
Demographics Similar to Japanese by Unemployment Among Women with Children Under 6 years
In terms of unemployment among women with children under 6 years, the demographic groups most similar to Japanese are Immigrants from Jordan (7.5%, a difference of 0.0%), European (7.5%, a difference of 0.030%), Immigrants from Oceania (7.5%, a difference of 0.050%), Immigrants from Brazil (7.5%, a difference of 0.16%), and Korean (7.5%, a difference of 0.26%).
| Demographics | Rating | Rank | Unemployment Among Women with Children Under 6 years |
| Immigrants | Colombia | 83.9 /100 | #139 | Excellent 7.4% |
| Scandinavians | 83.0 /100 | #140 | Excellent 7.4% |
| Greeks | 82.6 /100 | #141 | Excellent 7.4% |
| Immigrants | Argentina | 81.5 /100 | #142 | Excellent 7.5% |
| Koreans | 81.3 /100 | #143 | Excellent 7.5% |
| Europeans | 79.1 /100 | #144 | Good 7.5% |
| Immigrants | Jordan | 78.9 /100 | #145 | Good 7.5% |
| Japanese | 78.9 /100 | #146 | Good 7.5% |
| Immigrants | Oceania | 78.4 /100 | #147 | Good 7.5% |
| Immigrants | Brazil | 77.3 /100 | #148 | Good 7.5% |
| Colombians | 76.1 /100 | #149 | Good 7.5% |
| Aleuts | 76.0 /100 | #150 | Good 7.5% |
| Immigrants | Peru | 74.9 /100 | #151 | Good 7.5% |
| Bangladeshis | 74.8 /100 | #152 | Good 7.5% |
| Uruguayans | 74.7 /100 | #153 | Good 7.5% |