Immigrants from Hungary vs Immigrants from Korea Unemployment Among Seniors over 75 years

COMPARE

Immigrants from Hungary
Race
Ancestry
AfghanAfricanAlaska NativeAlaskan AthabascanAlbanianAleutAlsatianAmericanApacheArabArapahoArgentineanArmenianAssyrian/Chaldean/SyriacAustralianAustrianBahamianBangladeshiBarbadianBasqueBelgianBelizeanBermudanBhutaneseBlackfeetBolivianBrazilianBritishBritish West IndianBulgarianBurmeseCajunCambodianCanadianCape VerdeanCarpatho RusynCelticCentral AmericanCentral American IndianCherokeeCheyenneChickasawChileanChineseChippewaChoctawColombianColvilleComancheCosta RicanCreeCreekCroatianCrowCubanCypriotCzechCzechoslovakianDanishDelawareDominicanDutchDutch West IndianEastern EuropeanEcuadorianEgyptianEnglishEstonianEthiopianEuropeanFijianFilipinoFinnishFrenchFrench American IndianFrench CanadianGermanGerman RussianGhanaianGreekGuamanian/ChamorroGuatemalanGuyaneseHaitianHmongHonduranHopiHoumaHungarianIcelanderIndian (Asian)IndonesianInupiatIranianIraqiIrishIroquoisIsraeliItalianJamaicanJapaneseJordanianKenyanKiowaKoreanLaotianLatvianLebaneseLiberianLithuanianLumbeeLuxembourgerMacedonianMalaysianMalteseMarshalleseMexicanMexican American IndianMongolianMoroccanNative HawaiianNavajoNepaleseNew ZealanderNicaraguanNigerianNorthern EuropeanNorwegianOkinawanOsageOttawaPaiutePakistaniPalestinianPanamanianParaguayanPennsylvania GermanPeruvianPimaPolishPortuguesePotawatomiPuebloPuerto RicanPuget Sound SalishRomanianRussianSalvadoranSamoanScandinavianScotch-IrishScottishSeminoleSenegaleseSerbianShoshoneSierra LeoneanSiouxSlavicSlovakSloveneSomaliSouth AfricanSouth AmericanSouth American IndianSoviet UnionSpaniardSpanishSpanish AmericanSpanish American IndianSri LankanSubsaharan AfricanSudaneseSwedishSwissSyrianTaiwaneseThaiTlingit-HaidaTohono O'OdhamTonganTrinidadian and TobagonianTsimshianTurkishU.S. Virgin IslanderUgandanUkrainianUruguayanUteVenezuelanVietnameseWelshWest IndianYakamaYaquiYugoslavianYumanYup'ikZimbabwean
Immigration
NonimmigrantsImmigrantsAfghanistanAfricaAlbaniaArgentinaArmeniaAsiaAustraliaAustriaBahamasBangladeshBarbadosBelarusBelgiumBelizeBoliviaBosnia and HerzegovinaBrazilBulgariaBurma/MyanmarCabo VerdeCambodiaCameroonCanadaCaribbeanCentral AmericaChileChinaColombiaCongoCosta RicaCroatiaCubaCzechoslovakiaDenmarkDominicaDominican RepublicEastern AfricaEastern AsiaEastern EuropeEcuadorEgyptEl SalvadorEnglandEritreaEthiopiaEuropeFijiFranceGermanyGhanaGreeceGrenadaGuatemalaGuyanaHaitiHondurasHong KongHungaryIndiaIndonesiaIranIraqIrelandIsraelItalyJamaicaJapanJordanKazakhstanKenyaKuwaitLaosLatin AmericaLatviaLebanonLiberiaLithuaniaMalaysiaMexicoMicronesiaMiddle AfricaMoldovaMoroccoNepalNetherlandsNicaraguaNigeriaNorth AmericaNorth MacedoniaNorthern AfricaNorthern EuropeNorwayOceaniaPakistanPanamaPeruPhilippinesPolandPortugalRomaniaRussiaSaudi ArabiaScotlandSenegalSerbiaSierra LeoneSingaporeSomaliaSouth AfricaSouth AmericaSouth Central AsiaSouth Eastern AsiaSouthern EuropeSpainSri LankaSt. Vincent and the GrenadinesSudanSwedenSwitzerlandSyriaTaiwanThailandTrinidad and TobagoTurkeyUgandaUkraineUruguayUzbekistanVenezuelaVietnamWest IndiesWestern AfricaWestern AsiaWestern EuropeYemenZaireZimbabweAzores
Immigrants from Korea
Race
Ancestry
AfghanAfricanAlaska NativeAlaskan AthabascanAlbanianAleutAlsatianAmericanApacheArabArapahoArgentineanArmenianAssyrian/Chaldean/SyriacAustralianAustrianBahamianBangladeshiBarbadianBasqueBelgianBelizeanBermudanBhutaneseBlackfeetBolivianBrazilianBritishBritish West IndianBulgarianBurmeseCajunCambodianCanadianCape VerdeanCarpatho RusynCelticCentral AmericanCentral American IndianCherokeeCheyenneChickasawChileanChineseChippewaChoctawColombianColvilleComancheCosta RicanCreeCreekCroatianCrowCubanCypriotCzechCzechoslovakianDanishDelawareDominicanDutchDutch West IndianEastern EuropeanEcuadorianEgyptianEnglishEstonianEthiopianEuropeanFijianFilipinoFinnishFrenchFrench American IndianFrench CanadianGermanGerman RussianGhanaianGreekGuamanian/ChamorroGuatemalanGuyaneseHaitianHmongHonduranHopiHoumaHungarianIcelanderIndian (Asian)IndonesianInupiatIranianIraqiIrishIroquoisIsraeliItalianJamaicanJapaneseJordanianKenyanKiowaKoreanLaotianLatvianLebaneseLiberianLithuanianLumbeeLuxembourgerMacedonianMalaysianMalteseMarshalleseMexicanMexican American IndianMongolianMoroccanNative HawaiianNavajoNepaleseNew ZealanderNicaraguanNigerianNorthern EuropeanNorwegianOkinawanOsageOttawaPaiutePakistaniPalestinianPanamanianParaguayanPennsylvania GermanPeruvianPimaPolishPortuguesePotawatomiPuebloPuerto RicanPuget Sound SalishRomanianRussianSalvadoranSamoanScandinavianScotch-IrishScottishSeminoleSenegaleseSerbianShoshoneSierra LeoneanSiouxSlavicSlovakSloveneSomaliSouth AfricanSouth AmericanSouth American IndianSoviet UnionSpaniardSpanishSpanish AmericanSpanish American IndianSri LankanSubsaharan AfricanSudaneseSwedishSwissSyrianTaiwaneseThaiTlingit-HaidaTohono O'OdhamTonganTrinidadian and TobagonianTsimshianTurkishU.S. Virgin IslanderUgandanUkrainianUruguayanUteVenezuelanVietnameseWelshWest IndianYakamaYaquiYugoslavianYumanYup'ikZimbabwean
Immigration
NonimmigrantsImmigrantsAfghanistanAfricaAlbaniaArgentinaArmeniaAsiaAustraliaAustriaBahamasBangladeshBarbadosBelarusBelgiumBelizeBoliviaBosnia and HerzegovinaBrazilBulgariaBurma/MyanmarCabo VerdeCambodiaCameroonCanadaCaribbeanCentral AmericaChileChinaColombiaCongoCosta RicaCroatiaCubaCzechoslovakiaDenmarkDominicaDominican RepublicEastern AfricaEastern AsiaEastern EuropeEcuadorEgyptEl SalvadorEnglandEritreaEthiopiaEuropeFijiFranceGermanyGhanaGreeceGrenadaGuatemalaGuyanaHaitiHondurasHong KongIndiaIndonesiaIranIraqIrelandIsraelItalyJamaicaJapanJordanKazakhstanKenyaKoreaKuwaitLaosLatin AmericaLatviaLebanonLiberiaLithuaniaMalaysiaMexicoMicronesiaMiddle AfricaMoldovaMoroccoNepalNetherlandsNicaraguaNigeriaNorth AmericaNorth MacedoniaNorthern AfricaNorthern EuropeNorwayOceaniaPakistanPanamaPeruPhilippinesPolandPortugalRomaniaRussiaSaudi ArabiaScotlandSenegalSerbiaSierra LeoneSingaporeSomaliaSouth AfricaSouth AmericaSouth Central AsiaSouth Eastern AsiaSouthern EuropeSpainSri LankaSt. Vincent and the GrenadinesSudanSwedenSwitzerlandSyriaTaiwanThailandTrinidad and TobagoTurkeyUgandaUkraineUruguayUzbekistanVenezuelaVietnamWest IndiesWestern AfricaWestern AsiaWestern EuropeYemenZaireZimbabweAzores
Unemployment Among Seniors over 75 years
Income
Poverty
Unemployment
Labor Participation
Family Structure
Vehicle Availability
Education Level
Disability

Unemployment Among Seniors over 75 years Comparison

Immigrants from Hungary

Immigrants from Korea

Exceptional
Exceptional
7.7%
UNEMPLOYMENT AMONG SENIORS OVER 75 YEARS
100.0/ 100
METRIC RATING
37th/ 347
METRIC RANK
8.1%
UNEMPLOYMENT AMONG SENIORS OVER 75 YEARS
99.5/ 100
METRIC RATING
89th/ 347
METRIC RANK

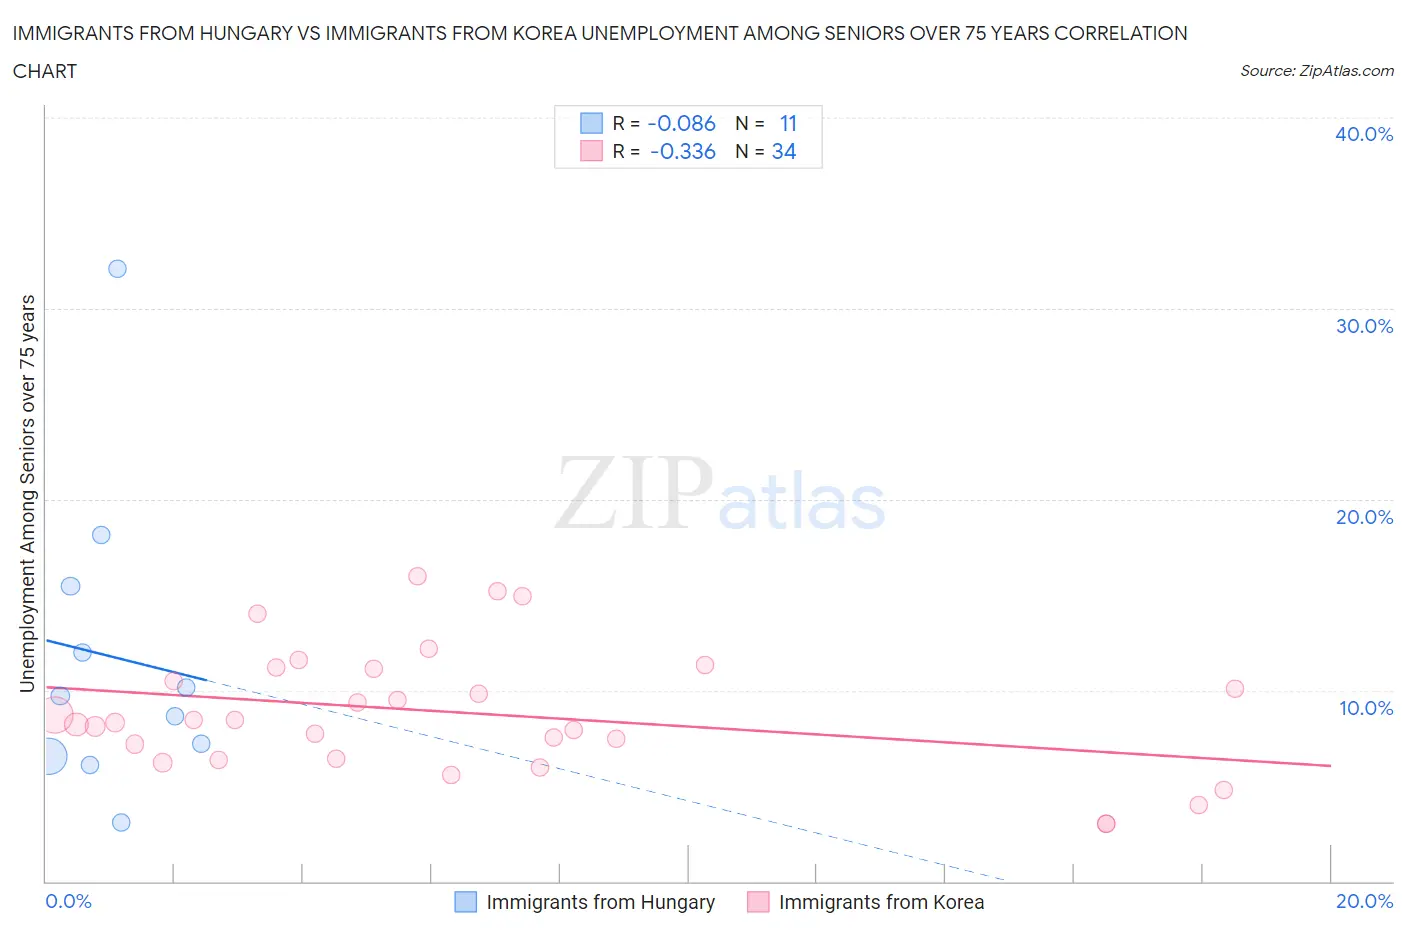
Immigrants from Hungary vs Immigrants from Korea Unemployment Among Seniors over 75 years Correlation Chart

The statistical analysis conducted on geographies consisting of 132,173,001 people shows a slight negative correlation between the proportion of Immigrants from Hungary and unemployment rate among seniors over the age of 75 in the United States with a correlation coefficient (R) of -0.086 and weighted average of 7.7%. Similarly, the statistical analysis conducted on geographies consisting of 206,994,306 people shows a mild negative correlation between the proportion of Immigrants from Korea and unemployment rate among seniors over the age of 75 in the United States with a correlation coefficient (R) of -0.336 and weighted average of 8.1%, a difference of 5.4%.
Immigrants from Hungary vs Immigrants from Korea Unemployment Among Seniors over 75 years

Unemployment Among Seniors over 75 years Correlation Summary

MeasurementImmigrants from HungaryImmigrants from Korea
Minimum3.1%3.0%
Maximum32.1%16.0%
Range29.0%13.0%
Mean11.7%8.8%
Median9.7%8.4%
Interquartile 25% (IQ1)6.5%6.4%
Interquartile 75% (IQ3)15.5%11.2%
Interquartile Range (IQR)8.9%4.8%
Standard Deviation (Sample)8.0%3.3%
Standard Deviation (Population)7.6%3.2%

Similar Demographics by Unemployment Among Seniors over 75 years

Demographics Similar to Immigrants from Hungary by Unemployment Among Seniors over 75 years

In terms of unemployment among seniors over 75 years, the demographic groups most similar to Immigrants from Hungary are Kiowa (7.7%, a difference of 0.020%), Ugandan (7.7%, a difference of 0.050%), Colville (7.7%, a difference of 0.080%), Luxembourger (7.7%, a difference of 0.20%), and Immigrants from Burma/Myanmar (7.7%, a difference of 0.21%).
DemographicsRating | RankUnemployment Among Seniors over 75 years
Immigrants | Sweden
100.0
/100
|
#30
Exceptional
7.6%
Guyanese
100.0
/100
|
#31
Exceptional
7.6%
Immigrants | Hong Kong
100.0
/100
|
#32
Exceptional
7.6%
Cambodians
100.0
/100
|
#33
Exceptional
7.6%
Immigrants | Eritrea
100.0
/100
|
#34
Exceptional
7.7%
Immigrants | Norway
100.0
/100
|
#35
Exceptional
7.7%
Luxembourgers
100.0
/100
|
#36
Exceptional
7.7%
Immigrants | Hungary
100.0
/100
|
#37
Exceptional
7.7%
Kiowa
100.0
/100
|
#38
Exceptional
7.7%
Ugandans
100.0
/100
|
#39
Exceptional
7.7%
Colville
100.0
/100
|
#40
Exceptional
7.7%
Immigrants | Burma/Myanmar
100.0
/100
|
#41
Exceptional
7.7%
Pueblo
100.0
/100
|
#42
Exceptional
7.7%
Immigrants | Denmark
100.0
/100
|
#43
Exceptional
7.8%
Immigrants | Spain
100.0
/100
|
#44
Exceptional
7.8%

Demographics Similar to Immigrants from Korea by Unemployment Among Seniors over 75 years

In terms of unemployment among seniors over 75 years, the demographic groups most similar to Immigrants from Korea are New Zealander (8.1%, a difference of 0.010%), Basque (8.1%, a difference of 0.050%), Immigrants from Vietnam (8.1%, a difference of 0.080%), Egyptian (8.1%, a difference of 0.12%), and Venezuelan (8.1%, a difference of 0.12%).
DemographicsRating | RankUnemployment Among Seniors over 75 years
Bhutanese
99.7
/100
|
#82
Exceptional
8.0%
Arapaho
99.7
/100
|
#83
Exceptional
8.1%
U.S. Virgin Islanders
99.7
/100
|
#84
Exceptional
8.1%
Immigrants | Indonesia
99.7
/100
|
#85
Exceptional
8.1%
Immigrants | Singapore
99.7
/100
|
#86
Exceptional
8.1%
Basques
99.5
/100
|
#87
Exceptional
8.1%
New Zealanders
99.5
/100
|
#88
Exceptional
8.1%
Immigrants | Korea
99.5
/100
|
#89
Exceptional
8.1%
Immigrants | Vietnam
99.5
/100
|
#90
Exceptional
8.1%
Egyptians
99.5
/100
|
#91
Exceptional
8.1%
Venezuelans
99.5
/100
|
#92
Exceptional
8.1%
Immigrants | Netherlands
99.5
/100
|
#93
Exceptional
8.1%
Immigrants | Ireland
99.4
/100
|
#94
Exceptional
8.1%
Nicaraguans
99.3
/100
|
#95
Exceptional
8.2%
Immigrants | Belgium
99.3
/100
|
#96
Exceptional
8.2%