Immigrants from Hungary vs Fijian Unemployment Among Ages 65 to 74 years
COMPARE
Immigrants from Hungary
Fijian
Unemployment Among Ages 65 to 74 years
Unemployment Among Ages 65 to 74 years Comparison
Immigrants from Hungary
Fijians
5.2%
UNEMPLOYMENT AMONG AGES 65 TO 74 YEARS
98.0/ 100
METRIC RATING
84th/ 347
METRIC RANK
4.5%
UNEMPLOYMENT AMONG AGES 65 TO 74 YEARS
100.0/ 100
METRIC RATING
3rd/ 347
METRIC RANK
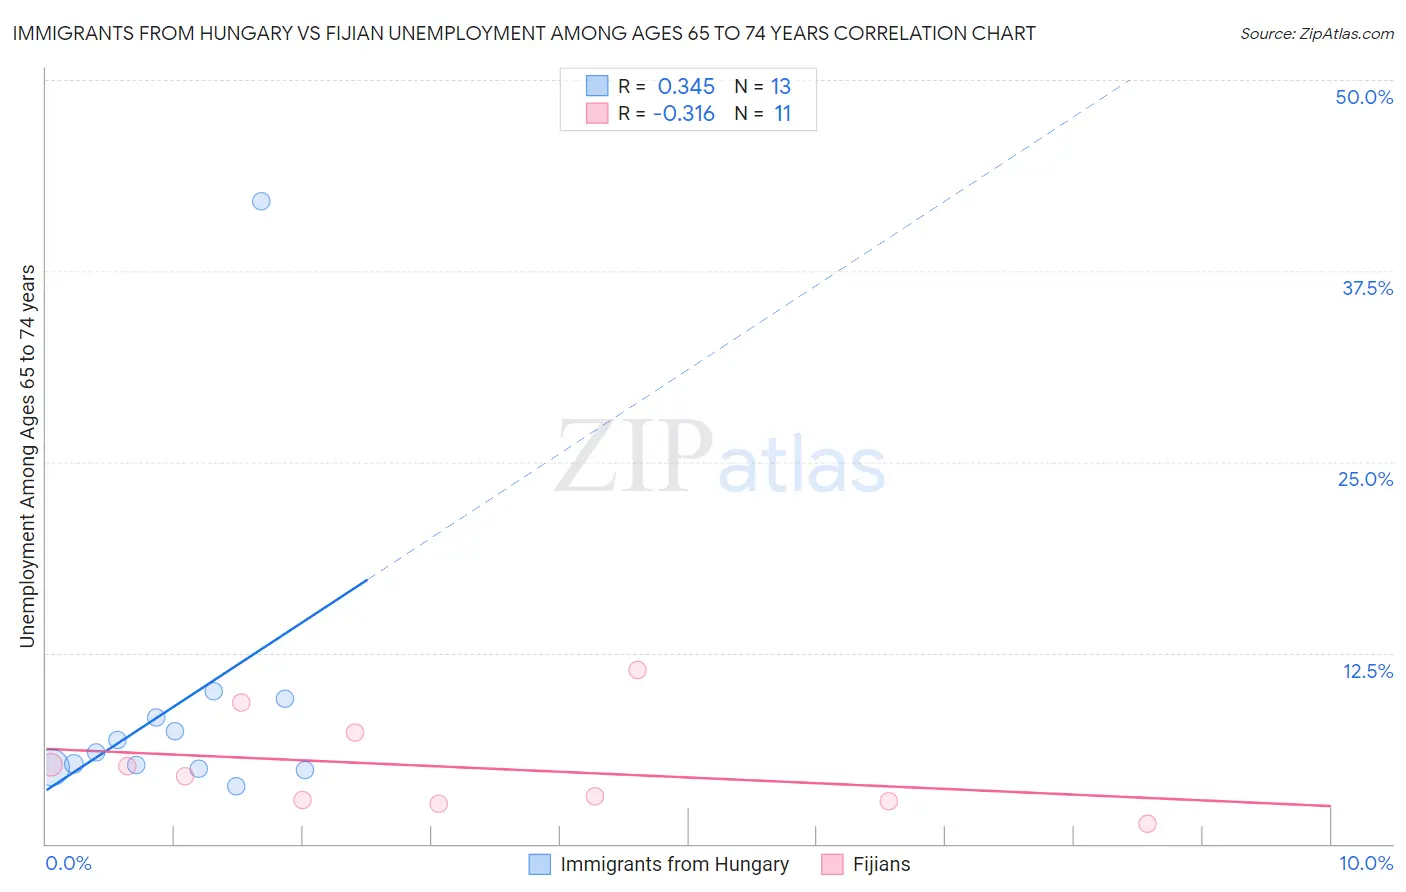
Immigrants from Hungary vs Fijian Unemployment Among Ages 65 to 74 years Correlation Chart
The statistical analysis conducted on geographies consisting of 184,599,970 people shows a mild positive correlation between the proportion of Immigrants from Hungary and unemployment rate among population between the ages 65 and 74 in the United States with a correlation coefficient (R) of 0.345 and weighted average of 5.2%. Similarly, the statistical analysis conducted on geographies consisting of 52,432,761 people shows a mild negative correlation between the proportion of Fijians and unemployment rate among population between the ages 65 and 74 in the United States with a correlation coefficient (R) of -0.316 and weighted average of 4.5%, a difference of 14.9%.
Unemployment Among Ages 65 to 74 years Correlation Summary
| Measurement | Immigrants from Hungary | Fijian |
| Minimum | 3.7% | 1.3% |
| Maximum | 42.1% | 11.4% |
| Range | 38.4% | 10.1% |
| Mean | 9.1% | 5.0% |
| Median | 6.0% | 4.4% |
| Interquartile 25% (IQ1) | 4.9% | 2.8% |
| Interquartile 75% (IQ3) | 8.9% | 7.3% |
| Interquartile Range (IQR) | 4.0% | 4.5% |
| Standard Deviation (Sample) | 10.1% | 3.1% |
| Standard Deviation (Population) | 9.7% | 3.0% |
Similar Demographics by Unemployment Among Ages 65 to 74 years
Demographics Similar to Immigrants from Hungary by Unemployment Among Ages 65 to 74 years
In terms of unemployment among ages 65 to 74 years, the demographic groups most similar to Immigrants from Hungary are British (5.2%, a difference of 0.040%), Danish (5.2%, a difference of 0.040%), Scottish (5.2%, a difference of 0.050%), Immigrants from Saudi Arabia (5.2%, a difference of 0.060%), and English (5.2%, a difference of 0.070%).
| Demographics | Rating | Rank | Unemployment Among Ages 65 to 74 years |
| Immigrants | Sudan | 98.9 /100 | #77 | Exceptional 5.2% |
| Northern Europeans | 98.9 /100 | #78 | Exceptional 5.2% |
| Slavs | 98.7 /100 | #79 | Exceptional 5.2% |
| Immigrants | South Africa | 98.6 /100 | #80 | Exceptional 5.2% |
| Immigrants | Scotland | 98.6 /100 | #81 | Exceptional 5.2% |
| Thais | 98.6 /100 | #82 | Exceptional 5.2% |
| Immigrants | Middle Africa | 98.4 /100 | #83 | Exceptional 5.2% |
| Immigrants | Hungary | 98.0 /100 | #84 | Exceptional 5.2% |
| British | 97.9 /100 | #85 | Exceptional 5.2% |
| Danes | 97.9 /100 | #86 | Exceptional 5.2% |
| Scottish | 97.9 /100 | #87 | Exceptional 5.2% |
| Immigrants | Saudi Arabia | 97.9 /100 | #88 | Exceptional 5.2% |
| English | 97.8 /100 | #89 | Exceptional 5.2% |
| Luxembourgers | 97.6 /100 | #90 | Exceptional 5.2% |
| Romanians | 97.4 /100 | #91 | Exceptional 5.2% |
Demographics Similar to Fijians by Unemployment Among Ages 65 to 74 years
In terms of unemployment among ages 65 to 74 years, the demographic groups most similar to Fijians are Tsimshian (4.6%, a difference of 1.5%), Chinese (4.4%, a difference of 1.6%), Sudanese (4.6%, a difference of 1.9%), Immigrants from Cuba (4.6%, a difference of 2.4%), and Indonesian (4.7%, a difference of 3.9%).
| Demographics | Rating | Rank | Unemployment Among Ages 65 to 74 years |
| Hmong | 100.0 /100 | #1 | Exceptional 4.2% |
| Chinese | 100.0 /100 | #2 | Exceptional 4.4% |
| Fijians | 100.0 /100 | #3 | Exceptional 4.5% |
| Tsimshian | 100.0 /100 | #4 | Exceptional 4.6% |
| Sudanese | 100.0 /100 | #5 | Exceptional 4.6% |
| Immigrants | Cuba | 100.0 /100 | #6 | Exceptional 4.6% |
| Indonesians | 100.0 /100 | #7 | Exceptional 4.7% |
| Comanche | 100.0 /100 | #8 | Exceptional 4.7% |
| Chickasaw | 100.0 /100 | #9 | Exceptional 4.7% |
| Osage | 100.0 /100 | #10 | Exceptional 4.7% |
| Immigrants | Congo | 100.0 /100 | #11 | Exceptional 4.7% |
| Tongans | 100.0 /100 | #12 | Exceptional 4.7% |
| Lumbee | 100.0 /100 | #13 | Exceptional 4.8% |
| Cubans | 100.0 /100 | #14 | Exceptional 4.8% |
| Immigrants | North Macedonia | 100.0 /100 | #15 | Exceptional 4.8% |