Immigrants from Hong Kong vs West Indian Unemployment Among Ages 35 to 44 years
COMPARE
Immigrants from Hong Kong
West Indian
Unemployment Among Ages 35 to 44 years
Unemployment Among Ages 35 to 44 years Comparison
Immigrants from Hong Kong
West Indians
4.4%
UNEMPLOYMENT AMONG AGES 35 TO 44 YEARS
97.2/ 100
METRIC RATING
57th/ 347
METRIC RANK
5.7%
UNEMPLOYMENT AMONG AGES 35 TO 44 YEARS
0.0/ 100
METRIC RATING
304th/ 347
METRIC RANK
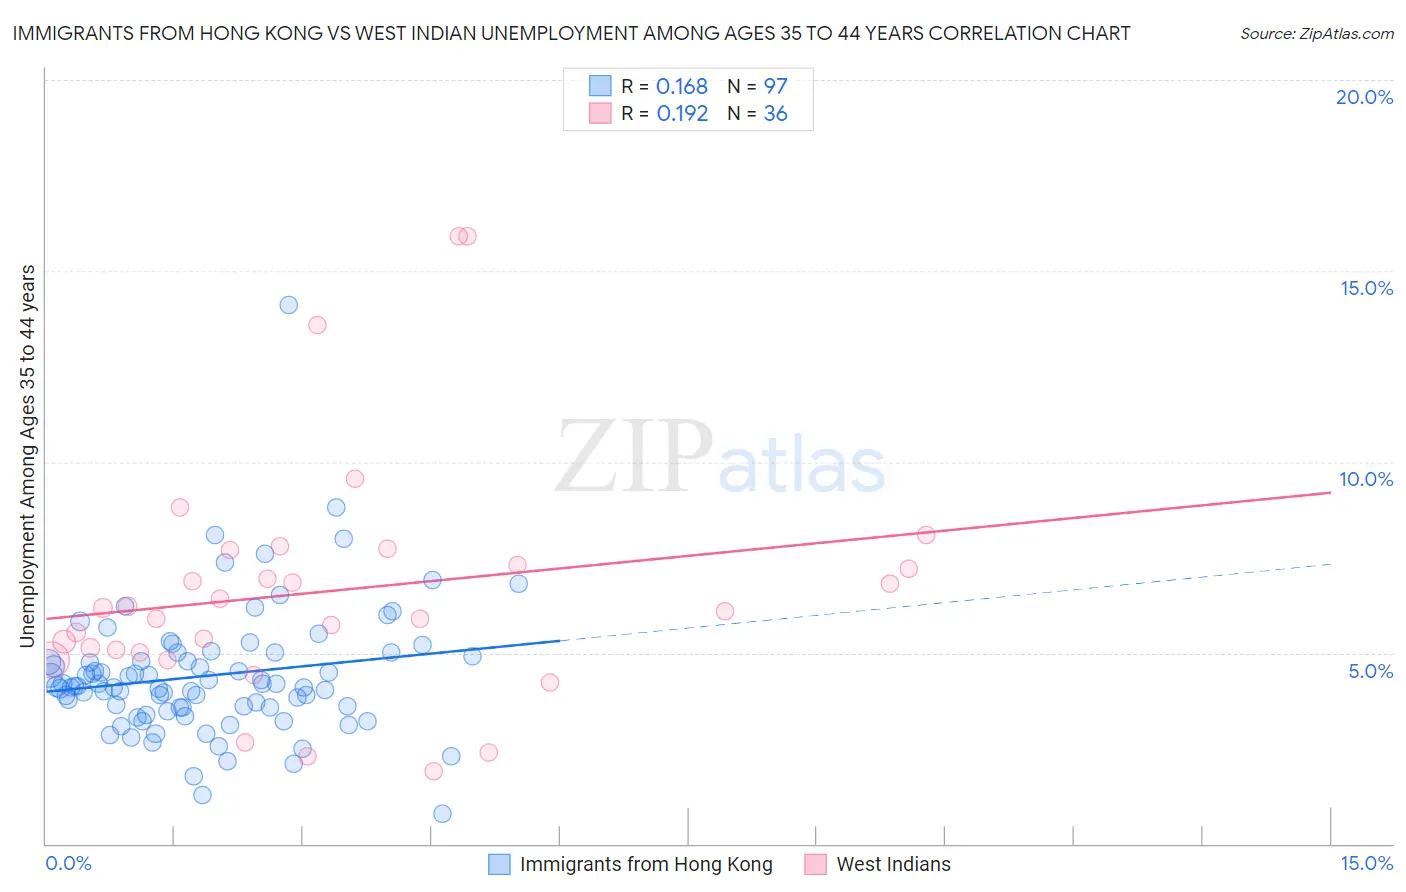
Immigrants from Hong Kong vs West Indian Unemployment Among Ages 35 to 44 years Correlation Chart
The statistical analysis conducted on geographies consisting of 251,425,888 people shows a poor positive correlation between the proportion of Immigrants from Hong Kong and unemployment rate among population between the ages 35 and 44 in the United States with a correlation coefficient (R) of 0.168 and weighted average of 4.4%. Similarly, the statistical analysis conducted on geographies consisting of 251,158,249 people shows a poor positive correlation between the proportion of West Indians and unemployment rate among population between the ages 35 and 44 in the United States with a correlation coefficient (R) of 0.192 and weighted average of 5.7%, a difference of 28.6%.
Unemployment Among Ages 35 to 44 years Correlation Summary
| Measurement | Immigrants from Hong Kong | West Indian |
| Minimum | 0.80% | 1.9% |
| Maximum | 14.1% | 15.9% |
| Range | 13.3% | 14.0% |
| Mean | 4.4% | 6.6% |
| Median | 4.1% | 6.1% |
| Interquartile 25% (IQ1) | 3.6% | 5.1% |
| Interquartile 75% (IQ3) | 5.0% | 7.5% |
| Interquartile Range (IQR) | 1.4% | 2.4% |
| Standard Deviation (Sample) | 1.7% | 3.2% |
| Standard Deviation (Population) | 1.7% | 3.1% |
Similar Demographics by Unemployment Among Ages 35 to 44 years
Demographics Similar to Immigrants from Hong Kong by Unemployment Among Ages 35 to 44 years
In terms of unemployment among ages 35 to 44 years, the demographic groups most similar to Immigrants from Hong Kong are English (4.4%, a difference of 0.020%), Greek (4.4%, a difference of 0.030%), Taiwanese (4.4%, a difference of 0.060%), Croatian (4.4%, a difference of 0.070%), and Immigrants from Bulgaria (4.4%, a difference of 0.070%).
| Demographics | Rating | Rank | Unemployment Among Ages 35 to 44 years |
| Immigrants | Turkey | 97.8 /100 | #50 | Exceptional 4.4% |
| Immigrants | Eastern Asia | 97.8 /100 | #51 | Exceptional 4.4% |
| Okinawans | 97.7 /100 | #52 | Exceptional 4.4% |
| Immigrants | Argentina | 97.6 /100 | #53 | Exceptional 4.4% |
| Asians | 97.4 /100 | #54 | Exceptional 4.4% |
| Immigrants | Moldova | 97.3 /100 | #55 | Exceptional 4.4% |
| Chileans | 97.3 /100 | #56 | Exceptional 4.4% |
| Immigrants | Hong Kong | 97.2 /100 | #57 | Exceptional 4.4% |
| English | 97.2 /100 | #58 | Exceptional 4.4% |
| Greeks | 97.1 /100 | #59 | Exceptional 4.4% |
| Taiwanese | 97.1 /100 | #60 | Exceptional 4.4% |
| Croatians | 97.1 /100 | #61 | Exceptional 4.4% |
| Immigrants | Bulgaria | 97.1 /100 | #62 | Exceptional 4.4% |
| Austrians | 97.1 /100 | #63 | Exceptional 4.4% |
| Immigrants | Serbia | 97.0 /100 | #64 | Exceptional 4.4% |
Demographics Similar to West Indians by Unemployment Among Ages 35 to 44 years
In terms of unemployment among ages 35 to 44 years, the demographic groups most similar to West Indians are Belizean (5.7%, a difference of 0.14%), Yakama (5.6%, a difference of 0.26%), Nepalese (5.6%, a difference of 0.98%), African (5.6%, a difference of 1.1%), and Immigrants from West Indies (5.6%, a difference of 1.1%).
| Demographics | Rating | Rank | Unemployment Among Ages 35 to 44 years |
| U.S. Virgin Islanders | 0.0 /100 | #297 | Tragic 5.6% |
| Aleuts | 0.0 /100 | #298 | Tragic 5.6% |
| Immigrants | Jamaica | 0.0 /100 | #299 | Tragic 5.6% |
| Immigrants | West Indies | 0.0 /100 | #300 | Tragic 5.6% |
| Africans | 0.0 /100 | #301 | Tragic 5.6% |
| Nepalese | 0.0 /100 | #302 | Tragic 5.6% |
| Yakama | 0.0 /100 | #303 | Tragic 5.6% |
| West Indians | 0.0 /100 | #304 | Tragic 5.7% |
| Belizeans | 0.0 /100 | #305 | Tragic 5.7% |
| Barbadians | 0.0 /100 | #306 | Tragic 5.7% |
| Immigrants | Belize | 0.0 /100 | #307 | Tragic 5.8% |
| Immigrants | Azores | 0.0 /100 | #308 | Tragic 5.8% |
| Immigrants | Barbados | 0.0 /100 | #309 | Tragic 5.8% |
| Guyanese | 0.0 /100 | #310 | Tragic 5.9% |
| Marshallese | 0.0 /100 | #311 | Tragic 5.9% |