Immigrants from Honduras vs Iroquois Unemployment Among Women with Children Under 18 years
COMPARE
Immigrants from Honduras
Iroquois
Unemployment Among Women with Children Under 18 years
Unemployment Among Women with Children Under 18 years Comparison
Immigrants from Honduras
Iroquois
6.5%
UNEMPLOYMENT AMONG WOMEN WITH CHILDREN UNDER 18 YEARS
0.0/ 100
METRIC RATING
303rd/ 347
METRIC RANK
5.7%
UNEMPLOYMENT AMONG WOMEN WITH CHILDREN UNDER 18 YEARS
6.5/ 100
METRIC RATING
219th/ 347
METRIC RANK
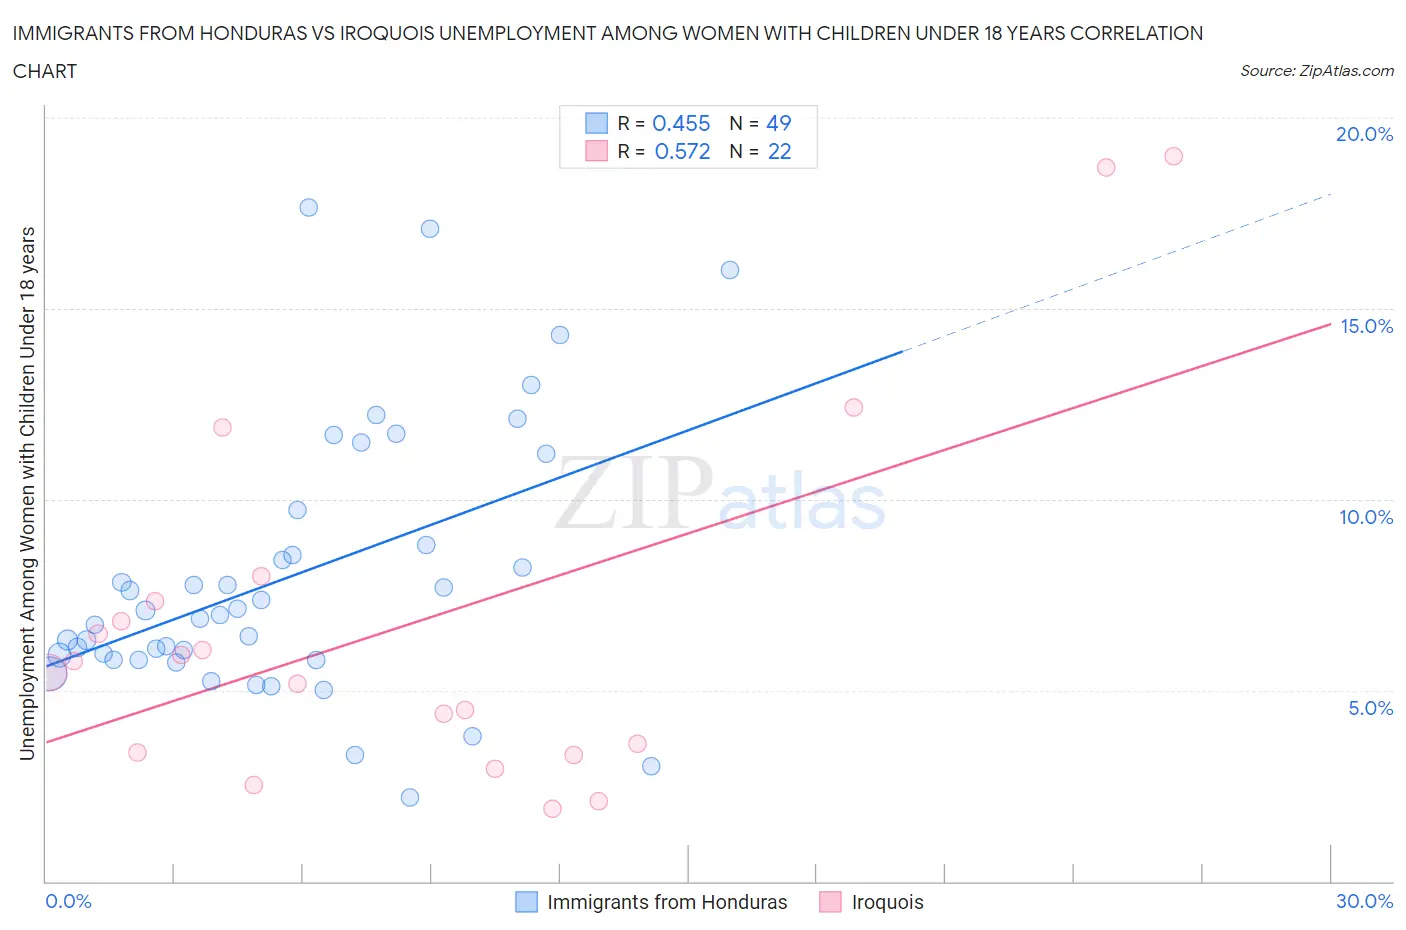
Immigrants from Honduras vs Iroquois Unemployment Among Women with Children Under 18 years Correlation Chart
The statistical analysis conducted on geographies consisting of 314,466,828 people shows a moderate positive correlation between the proportion of Immigrants from Honduras and unemployment rate among women with children under the age of 18 in the United States with a correlation coefficient (R) of 0.455 and weighted average of 6.5%. Similarly, the statistical analysis conducted on geographies consisting of 201,374,172 people shows a substantial positive correlation between the proportion of Iroquois and unemployment rate among women with children under the age of 18 in the United States with a correlation coefficient (R) of 0.572 and weighted average of 5.7%, a difference of 13.4%.
Unemployment Among Women with Children Under 18 years Correlation Summary
| Measurement | Immigrants from Honduras | Iroquois |
| Minimum | 2.2% | 1.9% |
| Maximum | 17.6% | 19.0% |
| Range | 15.4% | 17.1% |
| Mean | 7.9% | 6.7% |
| Median | 7.0% | 5.6% |
| Interquartile 25% (IQ1) | 5.8% | 3.4% |
| Interquartile 75% (IQ3) | 9.3% | 7.3% |
| Interquartile Range (IQR) | 3.5% | 4.0% |
| Standard Deviation (Sample) | 3.5% | 4.8% |
| Standard Deviation (Population) | 3.5% | 4.7% |
Similar Demographics by Unemployment Among Women with Children Under 18 years
Demographics Similar to Immigrants from Honduras by Unemployment Among Women with Children Under 18 years
In terms of unemployment among women with children under 18 years, the demographic groups most similar to Immigrants from Honduras are Vietnamese (6.5%, a difference of 0.0%), Immigrants from Armenia (6.5%, a difference of 0.23%), Immigrants from Haiti (6.4%, a difference of 0.49%), Immigrants from Jamaica (6.4%, a difference of 0.54%), and Jamaican (6.4%, a difference of 0.67%).
| Demographics | Rating | Rank | Unemployment Among Women with Children Under 18 years |
| Haitians | 0.0 /100 | #296 | Tragic 6.4% |
| Immigrants | Senegal | 0.0 /100 | #297 | Tragic 6.4% |
| Immigrants | Latin America | 0.0 /100 | #298 | Tragic 6.4% |
| Jamaicans | 0.0 /100 | #299 | Tragic 6.4% |
| Immigrants | Jamaica | 0.0 /100 | #300 | Tragic 6.4% |
| Immigrants | Haiti | 0.0 /100 | #301 | Tragic 6.4% |
| Immigrants | Armenia | 0.0 /100 | #302 | Tragic 6.5% |
| Immigrants | Honduras | 0.0 /100 | #303 | Tragic 6.5% |
| Vietnamese | 0.0 /100 | #304 | Tragic 6.5% |
| Immigrants | Central America | 0.0 /100 | #305 | Tragic 6.5% |
| Immigrants | Guyana | 0.0 /100 | #306 | Tragic 6.5% |
| Belizeans | 0.0 /100 | #307 | Tragic 6.5% |
| Africans | 0.0 /100 | #308 | Tragic 6.5% |
| Ecuadorians | 0.0 /100 | #309 | Tragic 6.5% |
| Guyanese | 0.0 /100 | #310 | Tragic 6.6% |
Demographics Similar to Iroquois by Unemployment Among Women with Children Under 18 years
In terms of unemployment among women with children under 18 years, the demographic groups most similar to Iroquois are Immigrants from Fiji (5.7%, a difference of 0.060%), Immigrants from Nicaragua (5.7%, a difference of 0.13%), Immigrants from Brazil (5.7%, a difference of 0.16%), Pennsylvania German (5.7%, a difference of 0.24%), and Immigrants from Peru (5.7%, a difference of 0.25%).
| Demographics | Rating | Rank | Unemployment Among Women with Children Under 18 years |
| South Americans | 10.0 /100 | #212 | Poor 5.7% |
| Americans | 8.9 /100 | #213 | Tragic 5.7% |
| Japanese | 8.7 /100 | #214 | Tragic 5.7% |
| Immigrants | Uganda | 7.9 /100 | #215 | Tragic 5.7% |
| Immigrants | Peru | 7.4 /100 | #216 | Tragic 5.7% |
| Immigrants | Brazil | 7.1 /100 | #217 | Tragic 5.7% |
| Immigrants | Nicaragua | 7.0 /100 | #218 | Tragic 5.7% |
| Iroquois | 6.5 /100 | #219 | Tragic 5.7% |
| Immigrants | Fiji | 6.3 /100 | #220 | Tragic 5.7% |
| Pennsylvania Germans | 5.7 /100 | #221 | Tragic 5.7% |
| Osage | 5.0 /100 | #222 | Tragic 5.7% |
| Potawatomi | 5.0 /100 | #223 | Tragic 5.7% |
| Immigrants | Syria | 4.6 /100 | #224 | Tragic 5.7% |
| Armenians | 4.5 /100 | #225 | Tragic 5.7% |
| Cherokee | 4.3 /100 | #226 | Tragic 5.7% |