Immigrants from Honduras vs Creek Unemployment Among Seniors over 65 years
COMPARE
Immigrants from Honduras
Creek
Unemployment Among Seniors over 65 years
Unemployment Among Seniors over 65 years Comparison
Immigrants from Honduras
Creek
5.2%
UNEMPLOYMENT AMONG SENIORS OVER 65 YEARS
10.2/ 100
METRIC RATING
212th/ 347
METRIC RANK
4.6%
UNEMPLOYMENT AMONG SENIORS OVER 65 YEARS
100.0/ 100
METRIC RATING
17th/ 347
METRIC RANK
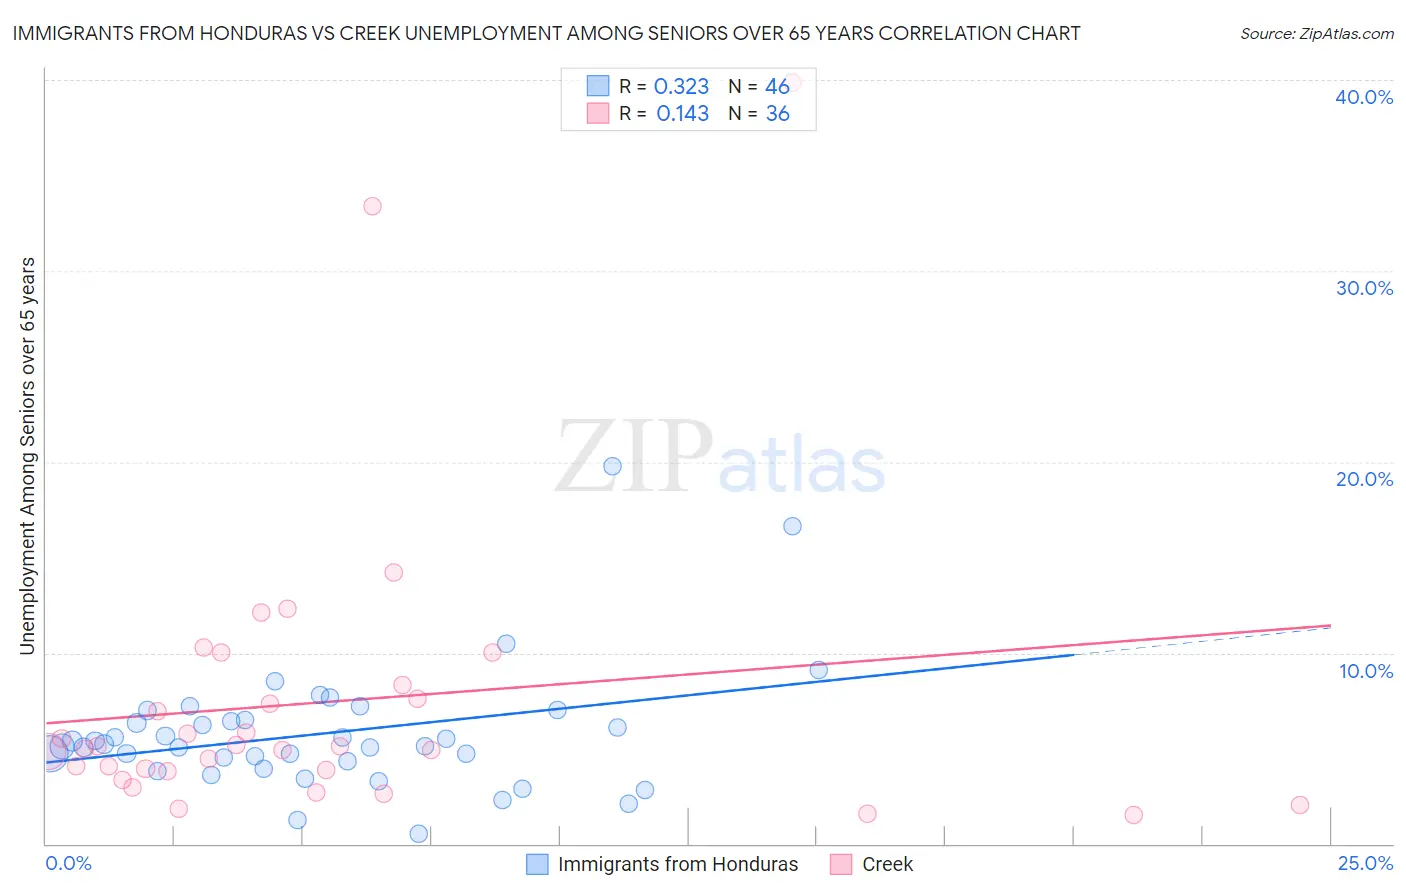
Immigrants from Honduras vs Creek Unemployment Among Seniors over 65 years Correlation Chart
The statistical analysis conducted on geographies consisting of 295,419,519 people shows a mild positive correlation between the proportion of Immigrants from Honduras and unemployment rate amomg seniors over the age of 65 in the United States with a correlation coefficient (R) of 0.323 and weighted average of 5.2%. Similarly, the statistical analysis conducted on geographies consisting of 165,420,086 people shows a poor positive correlation between the proportion of Creek and unemployment rate amomg seniors over the age of 65 in the United States with a correlation coefficient (R) of 0.143 and weighted average of 4.6%, a difference of 12.9%.
Unemployment Among Seniors over 65 years Correlation Summary
| Measurement | Immigrants from Honduras | Creek |
| Minimum | 0.50% | 1.5% |
| Maximum | 19.8% | 39.9% |
| Range | 19.3% | 38.4% |
| Mean | 5.8% | 7.4% |
| Median | 5.2% | 5.0% |
| Interquartile 25% (IQ1) | 4.3% | 3.8% |
| Interquartile 75% (IQ3) | 6.5% | 8.0% |
| Interquartile Range (IQR) | 2.2% | 4.1% |
| Standard Deviation (Sample) | 3.3% | 7.9% |
| Standard Deviation (Population) | 3.3% | 7.8% |
Similar Demographics by Unemployment Among Seniors over 65 years
Demographics Similar to Immigrants from Honduras by Unemployment Among Seniors over 65 years
In terms of unemployment among seniors over 65 years, the demographic groups most similar to Immigrants from Honduras are African (5.2%, a difference of 0.010%), Immigrants from Uzbekistan (5.2%, a difference of 0.040%), Immigrants from Uruguay (5.2%, a difference of 0.080%), Alsatian (5.2%, a difference of 0.090%), and Albanian (5.2%, a difference of 0.10%).
| Demographics | Rating | Rank | Unemployment Among Seniors over 65 years |
| South American Indians | 15.3 /100 | #205 | Poor 5.2% |
| German Russians | 14.7 /100 | #206 | Poor 5.2% |
| Immigrants | Philippines | 13.2 /100 | #207 | Poor 5.2% |
| Uruguayans | 12.6 /100 | #208 | Poor 5.2% |
| Alsatians | 11.4 /100 | #209 | Poor 5.2% |
| Immigrants | Uzbekistan | 10.7 /100 | #210 | Poor 5.2% |
| Africans | 10.4 /100 | #211 | Poor 5.2% |
| Immigrants | Honduras | 10.2 /100 | #212 | Poor 5.2% |
| Immigrants | Uruguay | 9.3 /100 | #213 | Tragic 5.2% |
| Albanians | 9.1 /100 | #214 | Tragic 5.2% |
| Immigrants | Fiji | 8.6 /100 | #215 | Tragic 5.2% |
| Cajuns | 8.5 /100 | #216 | Tragic 5.2% |
| Italians | 8.3 /100 | #217 | Tragic 5.2% |
| Spaniards | 7.4 /100 | #218 | Tragic 5.2% |
| Dutch West Indians | 6.9 /100 | #219 | Tragic 5.3% |
Demographics Similar to Creek by Unemployment Among Seniors over 65 years
In terms of unemployment among seniors over 65 years, the demographic groups most similar to Creek are Lumbee (4.6%, a difference of 0.11%), Immigrants from Burma/Myanmar (4.6%, a difference of 0.11%), Menominee (4.6%, a difference of 0.19%), Immigrants from Eritrea (4.7%, a difference of 0.29%), and Cuban (4.6%, a difference of 0.63%).
| Demographics | Rating | Rank | Unemployment Among Seniors over 65 years |
| Immigrants | Zaire | 100.0 /100 | #10 | Exceptional 4.5% |
| Comanche | 100.0 /100 | #11 | Exceptional 4.6% |
| Osage | 100.0 /100 | #12 | Exceptional 4.6% |
| Cubans | 100.0 /100 | #13 | Exceptional 4.6% |
| Menominee | 100.0 /100 | #14 | Exceptional 4.6% |
| Lumbee | 100.0 /100 | #15 | Exceptional 4.6% |
| Immigrants | Burma/Myanmar | 100.0 /100 | #16 | Exceptional 4.6% |
| Creek | 100.0 /100 | #17 | Exceptional 4.6% |
| Immigrants | Eritrea | 100.0 /100 | #18 | Exceptional 4.7% |
| Lebanese | 100.0 /100 | #19 | Exceptional 4.7% |
| Immigrants | Nepal | 100.0 /100 | #20 | Exceptional 4.7% |
| Norwegians | 100.0 /100 | #21 | Exceptional 4.7% |
| Czechs | 100.0 /100 | #22 | Exceptional 4.7% |
| Kenyans | 100.0 /100 | #23 | Exceptional 4.7% |
| Iraqis | 100.0 /100 | #24 | Exceptional 4.7% |