Immigrants from Haiti vs Yuman Unemployment Among Women with Children Under 6 years
COMPARE
Immigrants from Haiti
Yuman
Unemployment Among Women with Children Under 6 years
Unemployment Among Women with Children Under 6 years Comparison
Immigrants from Haiti
Yuman
8.4%
UNEMPLOYMENT AMONG WOMEN WITH CHILDREN UNDER 6 YEARS
0.2/ 100
METRIC RATING
269th/ 347
METRIC RANK
14.6%
UNEMPLOYMENT AMONG WOMEN WITH CHILDREN UNDER 6 YEARS
0.0/ 100
METRIC RATING
342nd/ 347
METRIC RANK
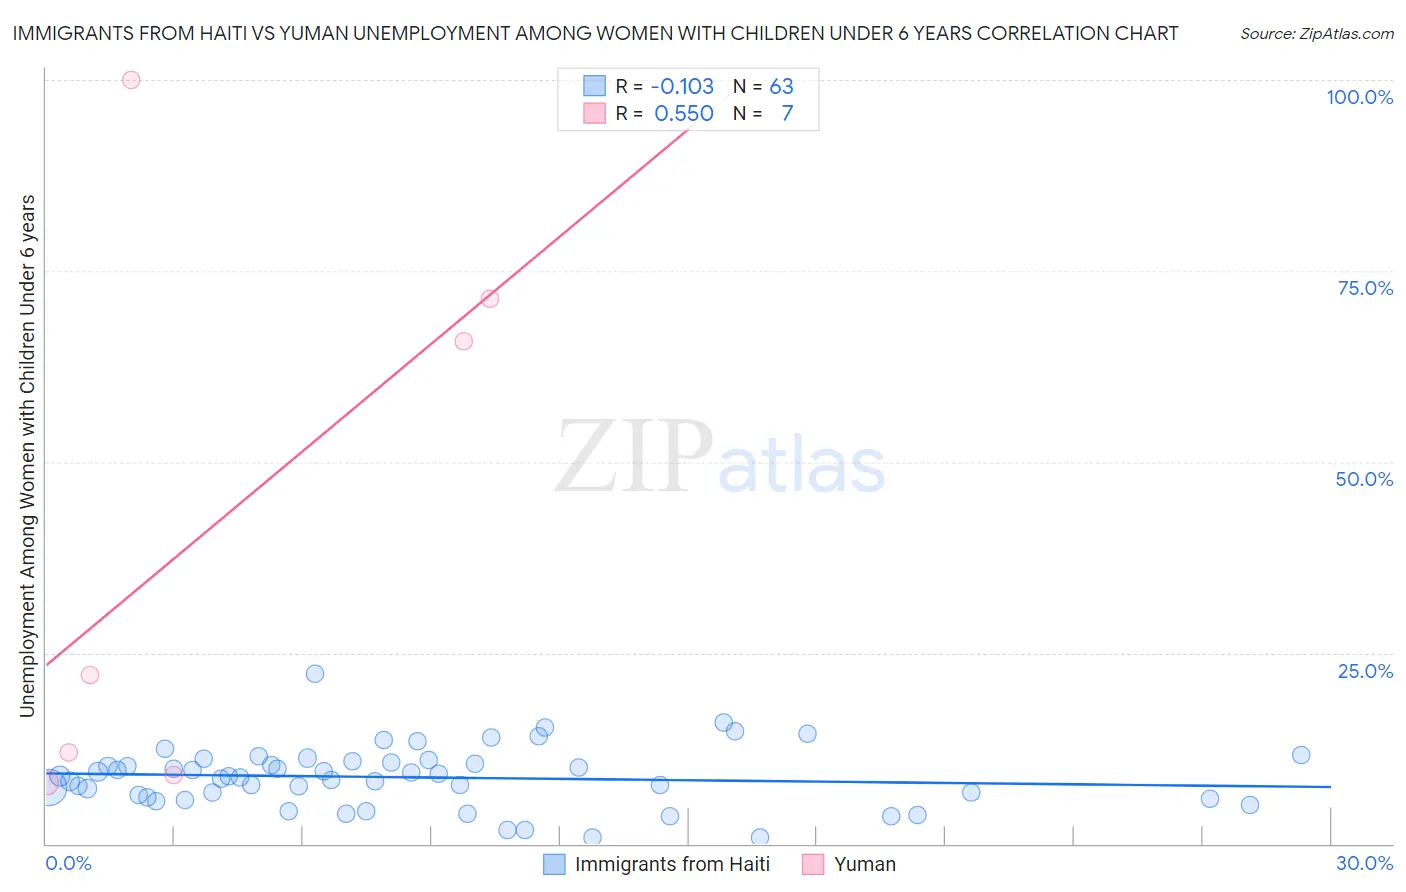
Immigrants from Haiti vs Yuman Unemployment Among Women with Children Under 6 years Correlation Chart
The statistical analysis conducted on geographies consisting of 184,706,407 people shows a poor negative correlation between the proportion of Immigrants from Haiti and unemployment rate among women with children under the age of 6 in the United States with a correlation coefficient (R) of -0.103 and weighted average of 8.4%. Similarly, the statistical analysis conducted on geographies consisting of 38,783,049 people shows a substantial positive correlation between the proportion of Yuman and unemployment rate among women with children under the age of 6 in the United States with a correlation coefficient (R) of 0.550 and weighted average of 14.6%, a difference of 73.4%.
Unemployment Among Women with Children Under 6 years Correlation Summary
| Measurement | Immigrants from Haiti | Yuman |
| Minimum | 0.80% | 8.0% |
| Maximum | 22.2% | 100.0% |
| Range | 21.4% | 92.0% |
| Mean | 8.7% | 41.2% |
| Median | 8.8% | 22.2% |
| Interquartile 25% (IQ1) | 6.1% | 9.0% |
| Interquartile 75% (IQ3) | 10.8% | 71.4% |
| Interquartile Range (IQR) | 4.7% | 62.4% |
| Standard Deviation (Sample) | 4.0% | 37.3% |
| Standard Deviation (Population) | 3.9% | 34.5% |
Similar Demographics by Unemployment Among Women with Children Under 6 years
Demographics Similar to Immigrants from Haiti by Unemployment Among Women with Children Under 6 years
In terms of unemployment among women with children under 6 years, the demographic groups most similar to Immigrants from Haiti are Subsaharan African (8.4%, a difference of 0.090%), Belizean (8.4%, a difference of 0.19%), Immigrants from Senegal (8.5%, a difference of 0.34%), Immigrants from Congo (8.5%, a difference of 0.35%), and Immigrants from Honduras (8.4%, a difference of 0.45%).
| Demographics | Rating | Rank | Unemployment Among Women with Children Under 6 years |
| West Indians | 0.3 /100 | #262 | Tragic 8.4% |
| Scotch-Irish | 0.3 /100 | #263 | Tragic 8.4% |
| Hondurans | 0.3 /100 | #264 | Tragic 8.4% |
| French Canadians | 0.3 /100 | #265 | Tragic 8.4% |
| Immigrants | Honduras | 0.3 /100 | #266 | Tragic 8.4% |
| Belizeans | 0.2 /100 | #267 | Tragic 8.4% |
| Sub-Saharan Africans | 0.2 /100 | #268 | Tragic 8.4% |
| Immigrants | Haiti | 0.2 /100 | #269 | Tragic 8.4% |
| Immigrants | Senegal | 0.2 /100 | #270 | Tragic 8.5% |
| Immigrants | Congo | 0.2 /100 | #271 | Tragic 8.5% |
| Mexican American Indians | 0.1 /100 | #272 | Tragic 8.5% |
| Slovaks | 0.1 /100 | #273 | Tragic 8.5% |
| Immigrants | Cameroon | 0.1 /100 | #274 | Tragic 8.6% |
| Immigrants | Latin America | 0.1 /100 | #275 | Tragic 8.6% |
| Yaqui | 0.0 /100 | #276 | Tragic 8.6% |
Demographics Similar to Yuman by Unemployment Among Women with Children Under 6 years
In terms of unemployment among women with children under 6 years, the demographic groups most similar to Yuman are Crow (14.6%, a difference of 0.090%), Lumbee (13.8%, a difference of 6.0%), Immigrants from Yemen (13.5%, a difference of 8.4%), Navajo (13.5%, a difference of 8.4%), and Pima (13.4%, a difference of 8.8%).
| Demographics | Rating | Rank | Unemployment Among Women with Children Under 6 years |
| Natives/Alaskans | 0.0 /100 | #333 | Tragic 11.5% |
| Apache | 0.0 /100 | #334 | Tragic 12.3% |
| Puerto Ricans | 0.0 /100 | #335 | Tragic 12.5% |
| Shoshone | 0.0 /100 | #336 | Tragic 13.2% |
| Chippewa | 0.0 /100 | #337 | Tragic 13.3% |
| Pima | 0.0 /100 | #338 | Tragic 13.4% |
| Navajo | 0.0 /100 | #339 | Tragic 13.5% |
| Immigrants | Yemen | 0.0 /100 | #340 | Tragic 13.5% |
| Lumbee | 0.0 /100 | #341 | Tragic 13.8% |
| Yuman | 0.0 /100 | #342 | Tragic 14.6% |
| Crow | 0.0 /100 | #343 | Tragic 14.6% |
| Hopi | 0.0 /100 | #344 | Tragic 16.8% |
| Inupiat | 0.0 /100 | #345 | Tragic 17.7% |
| Arapaho | 0.0 /100 | #346 | Tragic 19.0% |
| Yup'ik | 0.0 /100 | #347 | Tragic 21.1% |