Immigrants from Guyana vs Sierra Leonean Unemployment Among Seniors over 65 years
COMPARE
Immigrants from Guyana
Sierra Leonean
Unemployment Among Seniors over 65 years
Unemployment Among Seniors over 65 years Comparison
Immigrants from Guyana
Sierra Leoneans
5.6%
UNEMPLOYMENT AMONG SENIORS OVER 65 YEARS
0.0/ 100
METRIC RATING
311th/ 347
METRIC RANK
5.4%
UNEMPLOYMENT AMONG SENIORS OVER 65 YEARS
0.4/ 100
METRIC RATING
258th/ 347
METRIC RANK
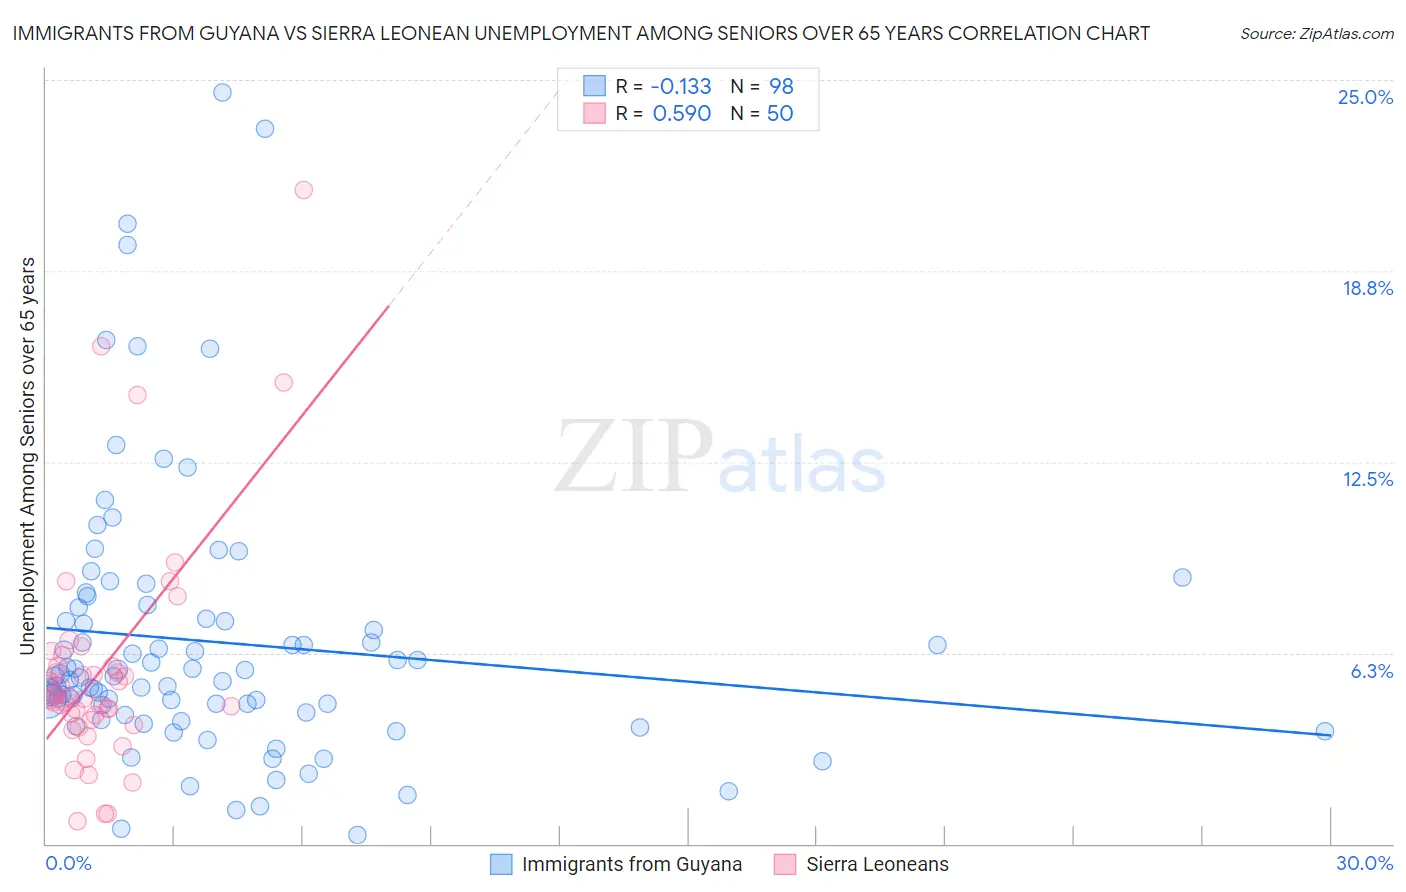
Immigrants from Guyana vs Sierra Leonean Unemployment Among Seniors over 65 years Correlation Chart
The statistical analysis conducted on geographies consisting of 174,172,541 people shows a poor negative correlation between the proportion of Immigrants from Guyana and unemployment rate amomg seniors over the age of 65 in the United States with a correlation coefficient (R) of -0.133 and weighted average of 5.6%. Similarly, the statistical analysis conducted on geographies consisting of 81,229,232 people shows a substantial positive correlation between the proportion of Sierra Leoneans and unemployment rate amomg seniors over the age of 65 in the United States with a correlation coefficient (R) of 0.590 and weighted average of 5.4%, a difference of 4.8%.
Unemployment Among Seniors over 65 years Correlation Summary
| Measurement | Immigrants from Guyana | Sierra Leonean |
| Minimum | 0.30% | 0.74% |
| Maximum | 24.6% | 21.4% |
| Range | 24.3% | 20.7% |
| Mean | 6.6% | 5.7% |
| Median | 5.5% | 4.8% |
| Interquartile 25% (IQ1) | 4.3% | 4.0% |
| Interquartile 75% (IQ3) | 7.4% | 5.8% |
| Interquartile Range (IQR) | 3.1% | 1.8% |
| Standard Deviation (Sample) | 4.5% | 3.8% |
| Standard Deviation (Population) | 4.5% | 3.8% |
Similar Demographics by Unemployment Among Seniors over 65 years
Demographics Similar to Immigrants from Guyana by Unemployment Among Seniors over 65 years
In terms of unemployment among seniors over 65 years, the demographic groups most similar to Immigrants from Guyana are Salvadoran (5.6%, a difference of 0.14%), Immigrants from Ecuador (5.6%, a difference of 0.14%), Barbadian (5.6%, a difference of 0.16%), Immigrants from Guatemala (5.6%, a difference of 0.18%), and Immigrants from St. Vincent and the Grenadines (5.6%, a difference of 0.39%).
| Demographics | Rating | Rank | Unemployment Among Seniors over 65 years |
| Liberians | 0.0 /100 | #304 | Tragic 5.6% |
| Mexicans | 0.0 /100 | #305 | Tragic 5.6% |
| Ecuadorians | 0.0 /100 | #306 | Tragic 5.6% |
| Portuguese | 0.0 /100 | #307 | Tragic 5.6% |
| Immigrants | St. Vincent and the Grenadines | 0.0 /100 | #308 | Tragic 5.6% |
| Immigrants | Guatemala | 0.0 /100 | #309 | Tragic 5.6% |
| Salvadorans | 0.0 /100 | #310 | Tragic 5.6% |
| Immigrants | Guyana | 0.0 /100 | #311 | Tragic 5.6% |
| Immigrants | Ecuador | 0.0 /100 | #312 | Tragic 5.6% |
| Barbadians | 0.0 /100 | #313 | Tragic 5.6% |
| Delaware | 0.0 /100 | #314 | Tragic 5.7% |
| Immigrants | El Salvador | 0.0 /100 | #315 | Tragic 5.7% |
| Immigrants | Central America | 0.0 /100 | #316 | Tragic 5.7% |
| Immigrants | Bahamas | 0.0 /100 | #317 | Tragic 5.7% |
| Vietnamese | 0.0 /100 | #318 | Tragic 5.7% |
Demographics Similar to Sierra Leoneans by Unemployment Among Seniors over 65 years
In terms of unemployment among seniors over 65 years, the demographic groups most similar to Sierra Leoneans are Immigrants from Micronesia (5.4%, a difference of 0.070%), Immigrants from Ghana (5.4%, a difference of 0.070%), Moroccan (5.4%, a difference of 0.16%), Immigrants from Peru (5.4%, a difference of 0.19%), and Paraguayan (5.4%, a difference of 0.20%).
| Demographics | Rating | Rank | Unemployment Among Seniors over 65 years |
| West Indians | 0.6 /100 | #251 | Tragic 5.4% |
| Trinidadians and Tobagonians | 0.6 /100 | #252 | Tragic 5.4% |
| Immigrants | Sierra Leone | 0.6 /100 | #253 | Tragic 5.4% |
| Paraguayans | 0.5 /100 | #254 | Tragic 5.4% |
| Immigrants | Peru | 0.5 /100 | #255 | Tragic 5.4% |
| Moroccans | 0.5 /100 | #256 | Tragic 5.4% |
| Immigrants | Micronesia | 0.4 /100 | #257 | Tragic 5.4% |
| Sierra Leoneans | 0.4 /100 | #258 | Tragic 5.4% |
| Immigrants | Ghana | 0.4 /100 | #259 | Tragic 5.4% |
| Native Hawaiians | 0.3 /100 | #260 | Tragic 5.4% |
| Spanish American Indians | 0.2 /100 | #261 | Tragic 5.4% |
| Immigrants | Grenada | 0.2 /100 | #262 | Tragic 5.4% |
| South Americans | 0.2 /100 | #263 | Tragic 5.4% |
| Central American Indians | 0.2 /100 | #264 | Tragic 5.4% |
| Immigrants | Colombia | 0.2 /100 | #265 | Tragic 5.4% |