Immigrants from Grenada vs Creek Male Unemployment
COMPARE
Immigrants from Grenada
Creek
Male Unemployment
Male Unemployment Comparison
Immigrants from Grenada
Creek
7.6%
MALE UNEMPLOYMENT
0.0/ 100
METRIC RATING
323rd/ 347
METRIC RANK
5.6%
MALE UNEMPLOYMENT
2.6/ 100
METRIC RATING
223rd/ 347
METRIC RANK
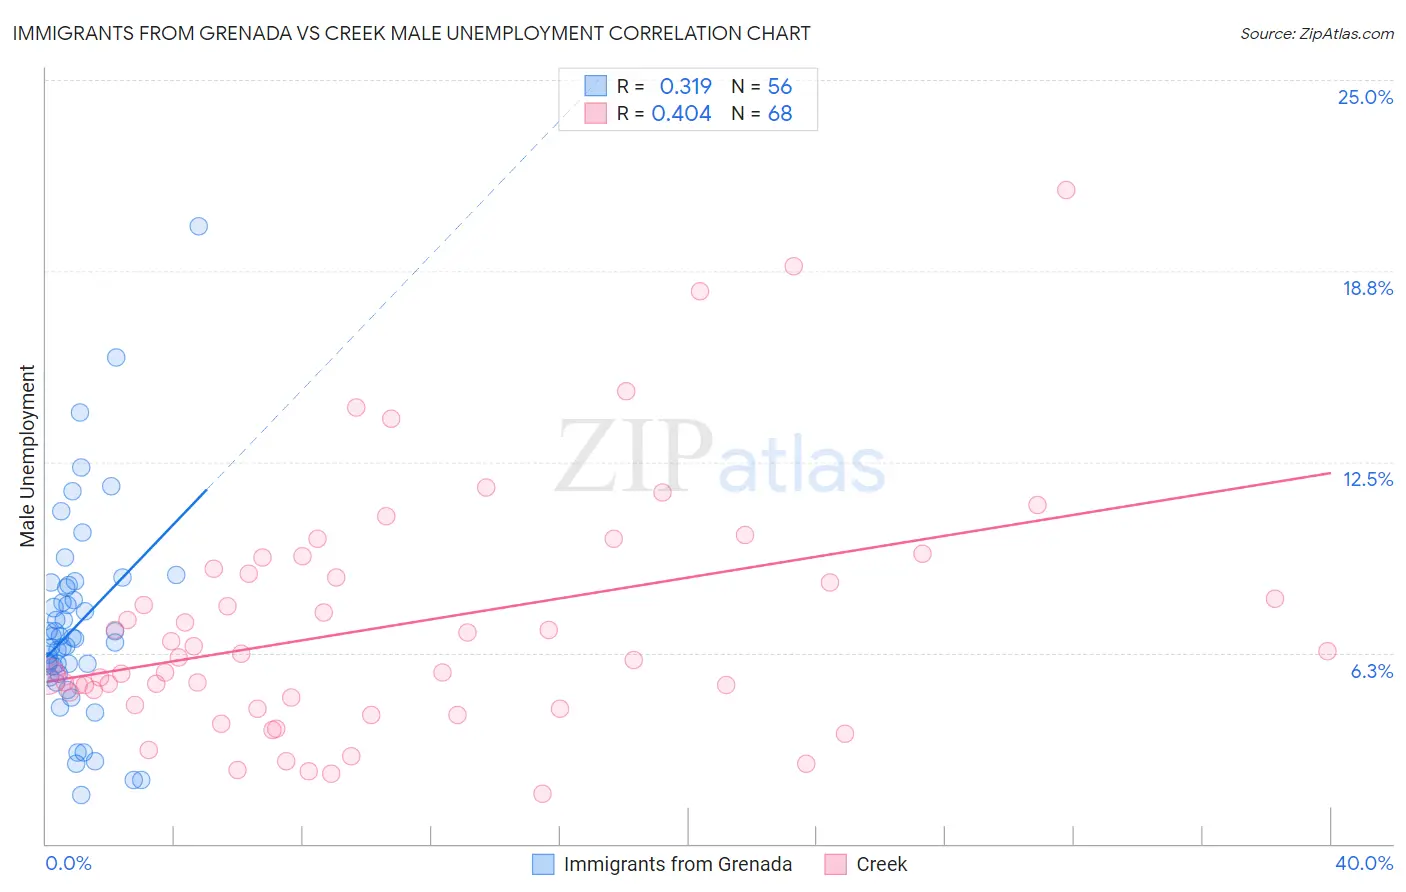
Immigrants from Grenada vs Creek Male Unemployment Correlation Chart
The statistical analysis conducted on geographies consisting of 67,158,645 people shows a mild positive correlation between the proportion of Immigrants from Grenada and unemployment rate among males in the United States with a correlation coefficient (R) of 0.319 and weighted average of 7.6%. Similarly, the statistical analysis conducted on geographies consisting of 177,831,732 people shows a moderate positive correlation between the proportion of Creek and unemployment rate among males in the United States with a correlation coefficient (R) of 0.404 and weighted average of 5.6%, a difference of 35.5%.
Male Unemployment Correlation Summary
| Measurement | Immigrants from Grenada | Creek |
| Minimum | 1.6% | 1.6% |
| Maximum | 20.2% | 21.4% |
| Range | 18.6% | 19.8% |
| Mean | 7.2% | 7.1% |
| Median | 6.7% | 6.1% |
| Interquartile 25% (IQ1) | 5.7% | 4.7% |
| Interquartile 75% (IQ3) | 8.4% | 8.9% |
| Interquartile Range (IQR) | 2.7% | 4.3% |
| Standard Deviation (Sample) | 3.3% | 4.0% |
| Standard Deviation (Population) | 3.3% | 3.9% |
Similar Demographics by Male Unemployment
Demographics Similar to Immigrants from Grenada by Male Unemployment
In terms of male unemployment, the demographic groups most similar to Immigrants from Grenada are Dominican (7.6%, a difference of 0.27%), Shoshone (7.6%, a difference of 0.65%), Immigrants from Dominican Republic (7.6%, a difference of 0.75%), Immigrants from Cabo Verde (7.5%, a difference of 0.79%), and Immigrants from St. Vincent and the Grenadines (7.5%, a difference of 1.1%).
| Demographics | Rating | Rank | Male Unemployment |
| Immigrants | Guyana | 0.0 /100 | #316 | Tragic 7.1% |
| Guyanese | 0.0 /100 | #317 | Tragic 7.1% |
| Cape Verdeans | 0.0 /100 | #318 | Tragic 7.1% |
| British West Indians | 0.0 /100 | #319 | Tragic 7.3% |
| Colville | 0.0 /100 | #320 | Tragic 7.4% |
| Immigrants | St. Vincent and the Grenadines | 0.0 /100 | #321 | Tragic 7.5% |
| Immigrants | Cabo Verde | 0.0 /100 | #322 | Tragic 7.5% |
| Immigrants | Grenada | 0.0 /100 | #323 | Tragic 7.6% |
| Dominicans | 0.0 /100 | #324 | Tragic 7.6% |
| Shoshone | 0.0 /100 | #325 | Tragic 7.6% |
| Immigrants | Dominican Republic | 0.0 /100 | #326 | Tragic 7.6% |
| Paiute | 0.0 /100 | #327 | Tragic 7.7% |
| Natives/Alaskans | 0.0 /100 | #328 | Tragic 7.7% |
| Immigrants | Yemen | 0.0 /100 | #329 | Tragic 7.8% |
| Yakama | 0.0 /100 | #330 | Tragic 7.9% |
Demographics Similar to Creek by Male Unemployment
In terms of male unemployment, the demographic groups most similar to Creek are Cherokee (5.6%, a difference of 0.13%), Immigrants from Micronesia (5.6%, a difference of 0.15%), Soviet Union (5.6%, a difference of 0.29%), Portuguese (5.6%, a difference of 0.40%), and Immigrants from Western Asia (5.6%, a difference of 0.42%).
| Demographics | Rating | Rank | Male Unemployment |
| Immigrants | Immigrants | 4.3 /100 | #216 | Tragic 5.5% |
| Delaware | 4.2 /100 | #217 | Tragic 5.5% |
| Immigrants | Albania | 3.6 /100 | #218 | Tragic 5.5% |
| Immigrants | Western Asia | 3.5 /100 | #219 | Tragic 5.6% |
| Portuguese | 3.5 /100 | #220 | Tragic 5.6% |
| Soviet Union | 3.2 /100 | #221 | Tragic 5.6% |
| Immigrants | Micronesia | 2.9 /100 | #222 | Tragic 5.6% |
| Creek | 2.6 /100 | #223 | Tragic 5.6% |
| Cherokee | 2.4 /100 | #224 | Tragic 5.6% |
| Panamanians | 1.9 /100 | #225 | Tragic 5.6% |
| Immigrants | Cambodia | 1.8 /100 | #226 | Tragic 5.6% |
| Immigrants | Panama | 1.8 /100 | #227 | Tragic 5.6% |
| Seminole | 1.8 /100 | #228 | Tragic 5.6% |
| Central Americans | 1.8 /100 | #229 | Tragic 5.6% |
| Immigrants | Africa | 1.7 /100 | #230 | Tragic 5.6% |