Immigrants from Greece vs Cuban Unemployment Among Ages 60 to 64 years
COMPARE
Immigrants from Greece
Cuban
Unemployment Among Ages 60 to 64 years
Unemployment Among Ages 60 to 64 years Comparison
Immigrants from Greece
Cubans
5.0%
UNEMPLOYMENT AMONG AGES 60 TO 64 YEARS
4.6/ 100
METRIC RATING
233rd/ 347
METRIC RANK
4.5%
UNEMPLOYMENT AMONG AGES 60 TO 64 YEARS
100.0/ 100
METRIC RATING
29th/ 347
METRIC RANK
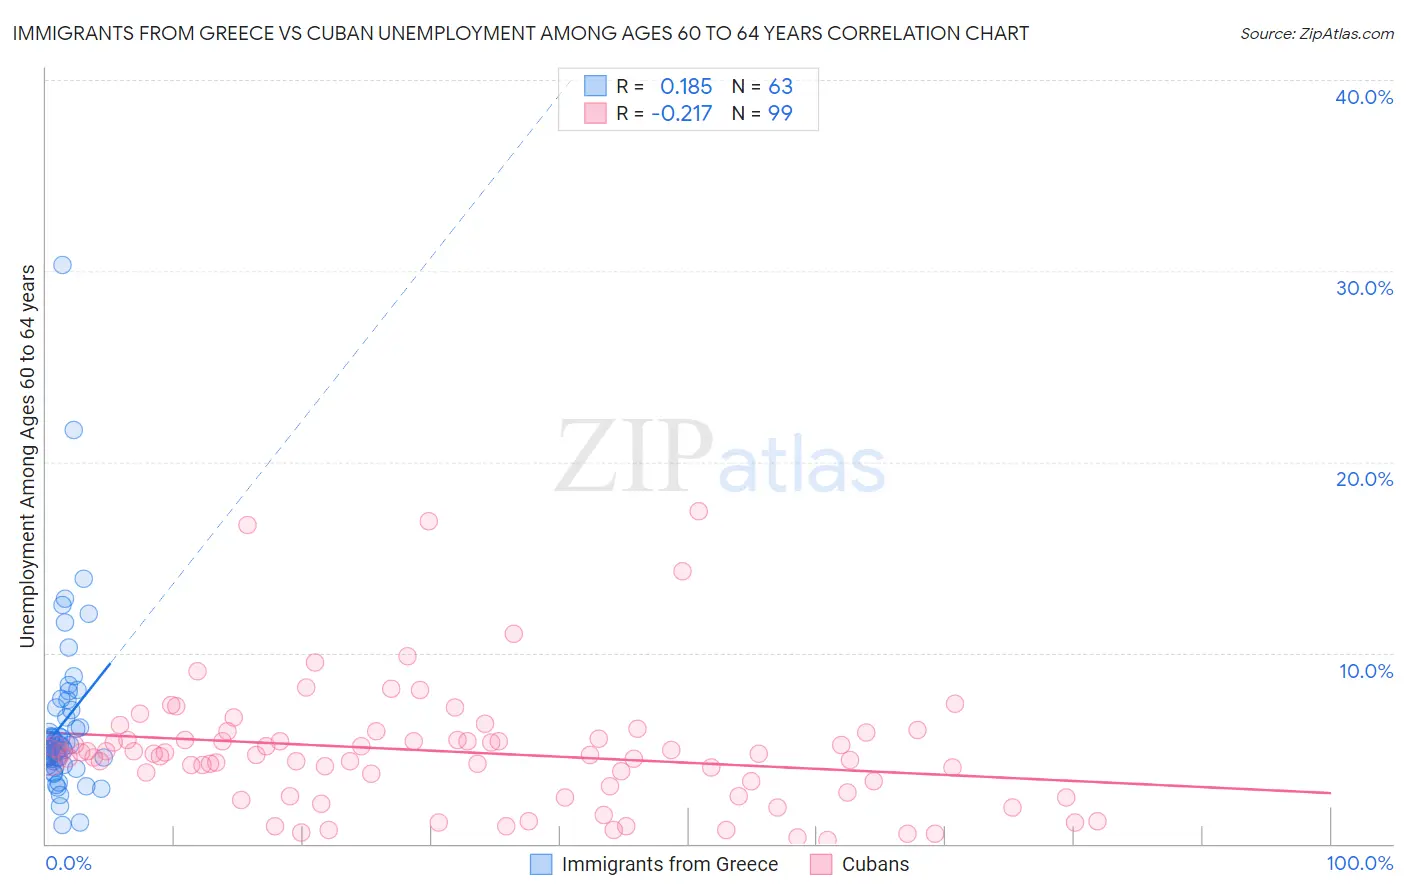
Immigrants from Greece vs Cuban Unemployment Among Ages 60 to 64 years Correlation Chart
The statistical analysis conducted on geographies consisting of 205,748,327 people shows a poor positive correlation between the proportion of Immigrants from Greece and unemployment rate among population between the ages 60 and 64 in the United States with a correlation coefficient (R) of 0.185 and weighted average of 5.0%. Similarly, the statistical analysis conducted on geographies consisting of 400,465,537 people shows a weak negative correlation between the proportion of Cubans and unemployment rate among population between the ages 60 and 64 in the United States with a correlation coefficient (R) of -0.217 and weighted average of 4.5%, a difference of 11.6%.
Unemployment Among Ages 60 to 64 years Correlation Summary
| Measurement | Immigrants from Greece | Cuban |
| Minimum | 0.95% | 0.20% |
| Maximum | 30.3% | 17.4% |
| Range | 29.3% | 17.2% |
| Mean | 6.3% | 4.8% |
| Median | 5.0% | 4.6% |
| Interquartile 25% (IQ1) | 4.3% | 2.7% |
| Interquartile 75% (IQ3) | 7.0% | 5.5% |
| Interquartile Range (IQR) | 2.7% | 2.8% |
| Standard Deviation (Sample) | 4.5% | 3.3% |
| Standard Deviation (Population) | 4.5% | 3.3% |
Similar Demographics by Unemployment Among Ages 60 to 64 years
Demographics Similar to Immigrants from Greece by Unemployment Among Ages 60 to 64 years
In terms of unemployment among ages 60 to 64 years, the demographic groups most similar to Immigrants from Greece are Immigrants from Eastern Asia (5.0%, a difference of 0.020%), Iranian (5.0%, a difference of 0.10%), Tohono O'odham (5.0%, a difference of 0.19%), Immigrants from Denmark (5.0%, a difference of 0.20%), and African (5.0%, a difference of 0.22%).
| Demographics | Rating | Rank | Unemployment Among Ages 60 to 64 years |
| Immigrants | Chile | 6.8 /100 | #226 | Tragic 5.0% |
| Nigerians | 6.8 /100 | #227 | Tragic 5.0% |
| Immigrants | Belarus | 6.4 /100 | #228 | Tragic 5.0% |
| Africans | 5.9 /100 | #229 | Tragic 5.0% |
| Immigrants | Denmark | 5.8 /100 | #230 | Tragic 5.0% |
| Tohono O'odham | 5.7 /100 | #231 | Tragic 5.0% |
| Immigrants | Eastern Asia | 4.7 /100 | #232 | Tragic 5.0% |
| Immigrants | Greece | 4.6 /100 | #233 | Tragic 5.0% |
| Iranians | 4.2 /100 | #234 | Tragic 5.0% |
| Delaware | 3.6 /100 | #235 | Tragic 5.0% |
| Immigrants | Sierra Leone | 3.1 /100 | #236 | Tragic 5.0% |
| Immigrants | Western Asia | 3.0 /100 | #237 | Tragic 5.0% |
| Immigrants | Poland | 3.0 /100 | #238 | Tragic 5.0% |
| Ghanaians | 2.4 /100 | #239 | Tragic 5.0% |
| Immigrants | Croatia | 2.2 /100 | #240 | Tragic 5.0% |
Demographics Similar to Cubans by Unemployment Among Ages 60 to 64 years
In terms of unemployment among ages 60 to 64 years, the demographic groups most similar to Cubans are Immigrants from Venezuela (4.5%, a difference of 0.020%), Immigrants from Eritrea (4.5%, a difference of 0.090%), Zimbabwean (4.5%, a difference of 0.13%), Carpatho Rusyn (4.5%, a difference of 0.18%), and Immigrants from Nepal (4.5%, a difference of 0.23%).
| Demographics | Rating | Rank | Unemployment Among Ages 60 to 64 years |
| Cape Verdeans | 100.0 /100 | #22 | Exceptional 4.4% |
| Immigrants | Zaire | 100.0 /100 | #23 | Exceptional 4.4% |
| Immigrants | Burma/Myanmar | 100.0 /100 | #24 | Exceptional 4.4% |
| Yugoslavians | 100.0 /100 | #25 | Exceptional 4.4% |
| Czechs | 100.0 /100 | #26 | Exceptional 4.4% |
| Immigrants | Iraq | 100.0 /100 | #27 | Exceptional 4.5% |
| Immigrants | Nepal | 100.0 /100 | #28 | Exceptional 4.5% |
| Cubans | 100.0 /100 | #29 | Exceptional 4.5% |
| Immigrants | Venezuela | 100.0 /100 | #30 | Exceptional 4.5% |
| Immigrants | Eritrea | 100.0 /100 | #31 | Exceptional 4.5% |
| Zimbabweans | 100.0 /100 | #32 | Exceptional 4.5% |
| Carpatho Rusyns | 100.0 /100 | #33 | Exceptional 4.5% |
| Belgians | 100.0 /100 | #34 | Exceptional 4.5% |
| Germans | 100.0 /100 | #35 | Exceptional 4.5% |
| Venezuelans | 100.0 /100 | #36 | Exceptional 4.5% |