Immigrants from Greece vs British Unemployment Among Ages 55 to 59 years
COMPARE
Immigrants from Greece
British
Unemployment Among Ages 55 to 59 years
Unemployment Among Ages 55 to 59 years Comparison
Immigrants from Greece
British
5.1%
UNEMPLOYMENT AMONG AGES 55 TO 59 YEARS
0.6/ 100
METRIC RATING
246th/ 347
METRIC RANK
4.5%
UNEMPLOYMENT AMONG AGES 55 TO 59 YEARS
99.8/ 100
METRIC RATING
45th/ 347
METRIC RANK
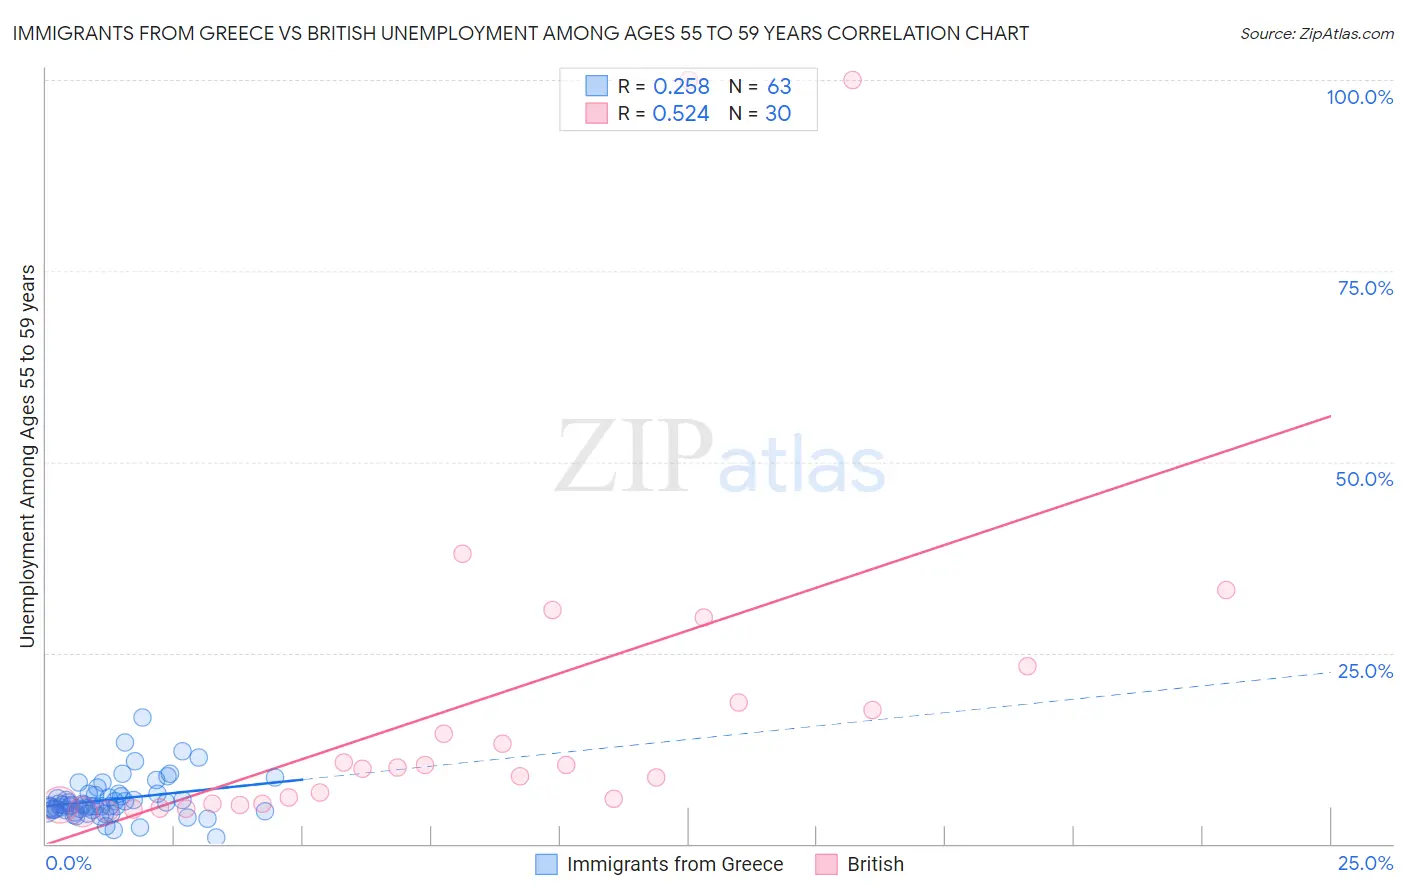
Immigrants from Greece vs British Unemployment Among Ages 55 to 59 years Correlation Chart
The statistical analysis conducted on geographies consisting of 208,718,729 people shows a weak positive correlation between the proportion of Immigrants from Greece and unemployment rate among population between the ages 55 and 59 in the United States with a correlation coefficient (R) of 0.258 and weighted average of 5.1%. Similarly, the statistical analysis conducted on geographies consisting of 464,678,607 people shows a substantial positive correlation between the proportion of British and unemployment rate among population between the ages 55 and 59 in the United States with a correlation coefficient (R) of 0.524 and weighted average of 4.5%, a difference of 12.3%.
Unemployment Among Ages 55 to 59 years Correlation Summary
| Measurement | Immigrants from Greece | British |
| Minimum | 0.78% | 4.2% |
| Maximum | 16.6% | 100.0% |
| Range | 15.8% | 95.8% |
| Mean | 5.8% | 18.3% |
| Median | 5.0% | 9.9% |
| Interquartile 25% (IQ1) | 4.4% | 5.2% |
| Interquartile 75% (IQ3) | 6.5% | 18.5% |
| Interquartile Range (IQR) | 2.1% | 13.3% |
| Standard Deviation (Sample) | 2.7% | 24.1% |
| Standard Deviation (Population) | 2.7% | 23.7% |
Similar Demographics by Unemployment Among Ages 55 to 59 years
Demographics Similar to Immigrants from Greece by Unemployment Among Ages 55 to 59 years
In terms of unemployment among ages 55 to 59 years, the demographic groups most similar to Immigrants from Greece are Soviet Union (5.1%, a difference of 0.010%), Immigrants from Honduras (5.1%, a difference of 0.010%), Native Hawaiian (5.1%, a difference of 0.18%), Comanche (5.1%, a difference of 0.21%), and Immigrants from Fiji (5.1%, a difference of 0.23%).
| Demographics | Rating | Rank | Unemployment Among Ages 55 to 59 years |
| French American Indians | 1.2 /100 | #239 | Tragic 5.0% |
| Immigrants | Costa Rica | 1.1 /100 | #240 | Tragic 5.0% |
| Brazilians | 1.0 /100 | #241 | Tragic 5.0% |
| Liberians | 0.9 /100 | #242 | Tragic 5.1% |
| Hondurans | 0.7 /100 | #243 | Tragic 5.1% |
| Immigrants | Fiji | 0.7 /100 | #244 | Tragic 5.1% |
| Soviet Union | 0.6 /100 | #245 | Tragic 5.1% |
| Immigrants | Greece | 0.6 /100 | #246 | Tragic 5.1% |
| Immigrants | Honduras | 0.5 /100 | #247 | Tragic 5.1% |
| Native Hawaiians | 0.5 /100 | #248 | Tragic 5.1% |
| Comanche | 0.4 /100 | #249 | Tragic 5.1% |
| Cheyenne | 0.4 /100 | #250 | Tragic 5.1% |
| Portuguese | 0.3 /100 | #251 | Tragic 5.1% |
| U.S. Virgin Islanders | 0.3 /100 | #252 | Tragic 5.1% |
| Paraguayans | 0.3 /100 | #253 | Tragic 5.1% |
Demographics Similar to British by Unemployment Among Ages 55 to 59 years
In terms of unemployment among ages 55 to 59 years, the demographic groups most similar to British are Immigrants from Zaire (4.5%, a difference of 0.020%), Immigrants from Korea (4.5%, a difference of 0.070%), European (4.5%, a difference of 0.070%), German Russian (4.5%, a difference of 0.080%), and Immigrants from Kuwait (4.5%, a difference of 0.11%).
| Demographics | Rating | Rank | Unemployment Among Ages 55 to 59 years |
| Assyrians/Chaldeans/Syriacs | 99.9 /100 | #38 | Exceptional 4.5% |
| English | 99.9 /100 | #39 | Exceptional 4.5% |
| Swiss | 99.8 /100 | #40 | Exceptional 4.5% |
| Luxembourgers | 99.8 /100 | #41 | Exceptional 4.5% |
| Immigrants | Kuwait | 99.8 /100 | #42 | Exceptional 4.5% |
| Immigrants | Korea | 99.8 /100 | #43 | Exceptional 4.5% |
| Europeans | 99.8 /100 | #44 | Exceptional 4.5% |
| British | 99.8 /100 | #45 | Exceptional 4.5% |
| Immigrants | Zaire | 99.8 /100 | #46 | Exceptional 4.5% |
| German Russians | 99.8 /100 | #47 | Exceptional 4.5% |
| Immigrants | Moldova | 99.7 /100 | #48 | Exceptional 4.5% |
| Immigrants | Saudi Arabia | 99.7 /100 | #49 | Exceptional 4.5% |
| Immigrants | Pakistan | 99.7 /100 | #50 | Exceptional 4.5% |
| Maltese | 99.7 /100 | #51 | Exceptional 4.5% |
| Scottish | 99.7 /100 | #52 | Exceptional 4.5% |