Immigrants from Greece vs African Unemployment
COMPARE
Immigrants from Greece
African
Unemployment
Unemployment Comparison
Immigrants from Greece
Africans
5.3%
UNEMPLOYMENT
45.0/ 100
METRIC RATING
180th/ 347
METRIC RANK
6.1%
UNEMPLOYMENT
0.0/ 100
METRIC RATING
281st/ 347
METRIC RANK
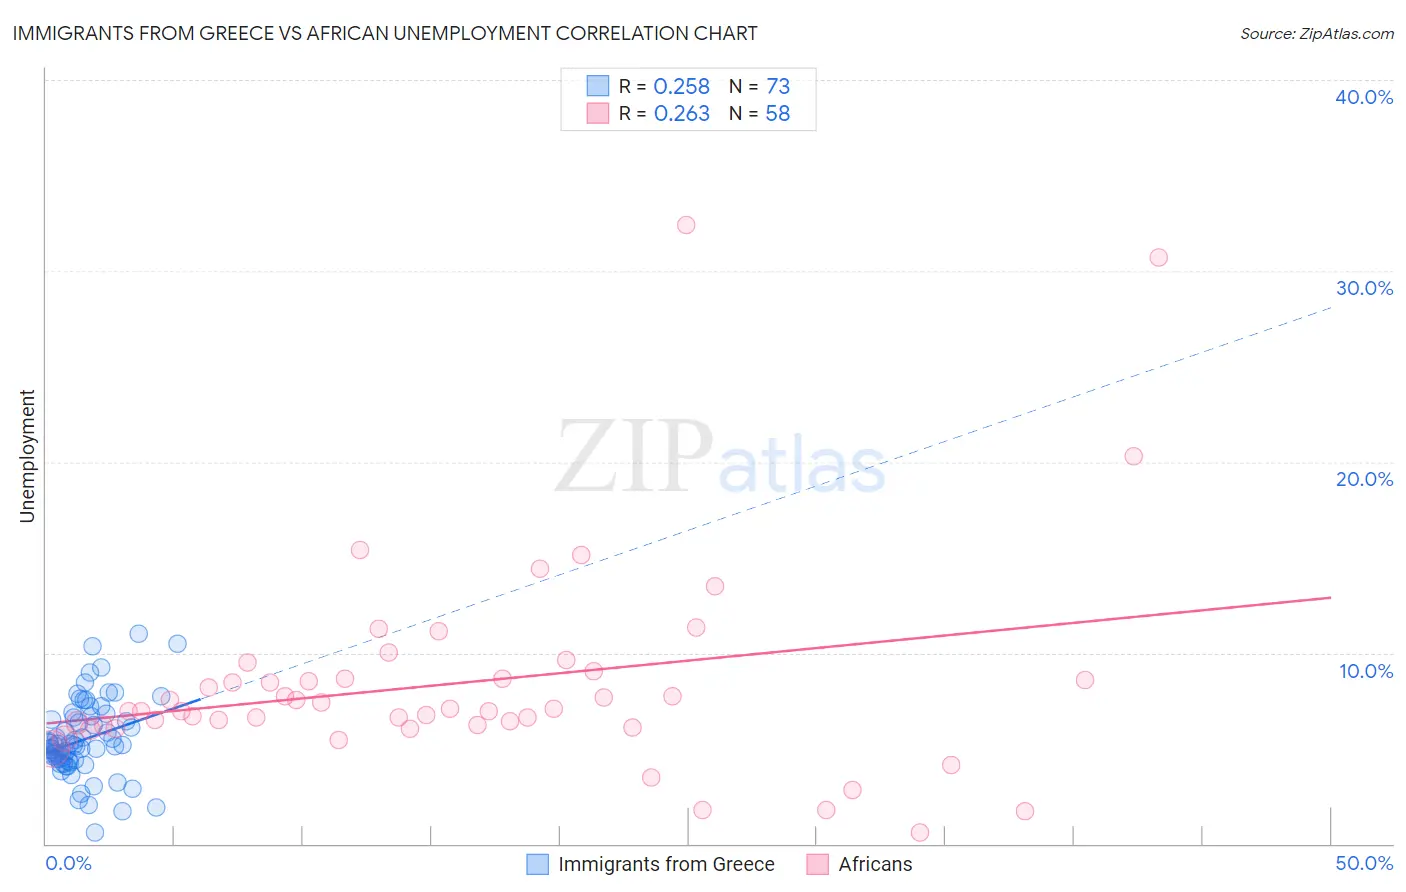
Immigrants from Greece vs African Unemployment Correlation Chart
The statistical analysis conducted on geographies consisting of 216,814,520 people shows a weak positive correlation between the proportion of Immigrants from Greece and unemployment in the United States with a correlation coefficient (R) of 0.258 and weighted average of 5.3%. Similarly, the statistical analysis conducted on geographies consisting of 469,312,899 people shows a weak positive correlation between the proportion of Africans and unemployment in the United States with a correlation coefficient (R) of 0.263 and weighted average of 6.1%, a difference of 14.8%.
Unemployment Correlation Summary
| Measurement | Immigrants from Greece | African |
| Minimum | 0.60% | 0.60% |
| Maximum | 11.0% | 32.4% |
| Range | 10.4% | 31.8% |
| Mean | 5.5% | 8.4% |
| Median | 5.2% | 7.0% |
| Interquartile 25% (IQ1) | 4.3% | 6.2% |
| Interquartile 75% (IQ3) | 6.6% | 8.6% |
| Interquartile Range (IQR) | 2.3% | 2.4% |
| Standard Deviation (Sample) | 2.0% | 5.6% |
| Standard Deviation (Population) | 2.0% | 5.5% |
Similar Demographics by Unemployment
Demographics Similar to Immigrants from Greece by Unemployment
In terms of unemployment, the demographic groups most similar to Immigrants from Greece are Albanian (5.3%, a difference of 0.090%), Malaysian (5.3%, a difference of 0.11%), Afghan (5.3%, a difference of 0.15%), Nonimmigrants (5.3%, a difference of 0.18%), and Spaniard (5.3%, a difference of 0.18%).
| Demographics | Rating | Rank | Unemployment |
| Immigrants | Poland | 51.8 /100 | #173 | Average 5.3% |
| Immigrants | Congo | 50.0 /100 | #174 | Average 5.3% |
| Taiwanese | 49.6 /100 | #175 | Average 5.3% |
| Nicaraguans | 48.7 /100 | #176 | Average 5.3% |
| Immigrants | Nonimmigrants | 47.9 /100 | #177 | Average 5.3% |
| Afghans | 47.4 /100 | #178 | Average 5.3% |
| Malaysians | 46.8 /100 | #179 | Average 5.3% |
| Immigrants | Greece | 45.0 /100 | #180 | Average 5.3% |
| Albanians | 43.5 /100 | #181 | Average 5.3% |
| Spaniards | 42.2 /100 | #182 | Average 5.3% |
| Brazilians | 40.2 /100 | #183 | Average 5.3% |
| Assyrians/Chaldeans/Syriacs | 39.2 /100 | #184 | Fair 5.3% |
| Immigrants | Thailand | 38.9 /100 | #185 | Fair 5.3% |
| Immigrants | Uganda | 37.8 /100 | #186 | Fair 5.3% |
| Costa Ricans | 37.4 /100 | #187 | Fair 5.3% |
Demographics Similar to Africans by Unemployment
In terms of unemployment, the demographic groups most similar to Africans are Immigrants from the Azores (6.1%, a difference of 0.060%), Immigrants from Ghana (6.1%, a difference of 0.15%), Aleut (6.1%, a difference of 0.28%), Immigrants from Mexico (6.0%, a difference of 0.58%), and Immigrants from Western Africa (6.0%, a difference of 0.58%).
| Demographics | Rating | Rank | Unemployment |
| Bahamians | 0.0 /100 | #274 | Tragic 5.9% |
| Immigrants | Latin America | 0.0 /100 | #275 | Tragic 5.9% |
| Immigrants | Central America | 0.0 /100 | #276 | Tragic 6.0% |
| Armenians | 0.0 /100 | #277 | Tragic 6.0% |
| Ghanaians | 0.0 /100 | #278 | Tragic 6.0% |
| Immigrants | Mexico | 0.0 /100 | #279 | Tragic 6.0% |
| Immigrants | Western Africa | 0.0 /100 | #280 | Tragic 6.0% |
| Africans | 0.0 /100 | #281 | Tragic 6.1% |
| Immigrants | Azores | 0.0 /100 | #282 | Tragic 6.1% |
| Immigrants | Ghana | 0.0 /100 | #283 | Tragic 6.1% |
| Aleuts | 0.0 /100 | #284 | Tragic 6.1% |
| Immigrants | Senegal | 0.0 /100 | #285 | Tragic 6.1% |
| Immigrants | Caribbean | 0.0 /100 | #286 | Tragic 6.2% |
| Nepalese | 0.0 /100 | #287 | Tragic 6.2% |
| Ecuadorians | 0.0 /100 | #288 | Tragic 6.2% |