Immigrants from Ghana vs Swedish Unemployment Among Ages 60 to 64 years
COMPARE
Immigrants from Ghana
Swedish
Unemployment Among Ages 60 to 64 years
Unemployment Among Ages 60 to 64 years Comparison
Immigrants from Ghana
Swedes
5.1%
UNEMPLOYMENT AMONG AGES 60 TO 64 YEARS
0.4/ 100
METRIC RATING
261st/ 347
METRIC RANK
4.5%
UNEMPLOYMENT AMONG AGES 60 TO 64 YEARS
100.0/ 100
METRIC RATING
43rd/ 347
METRIC RANK
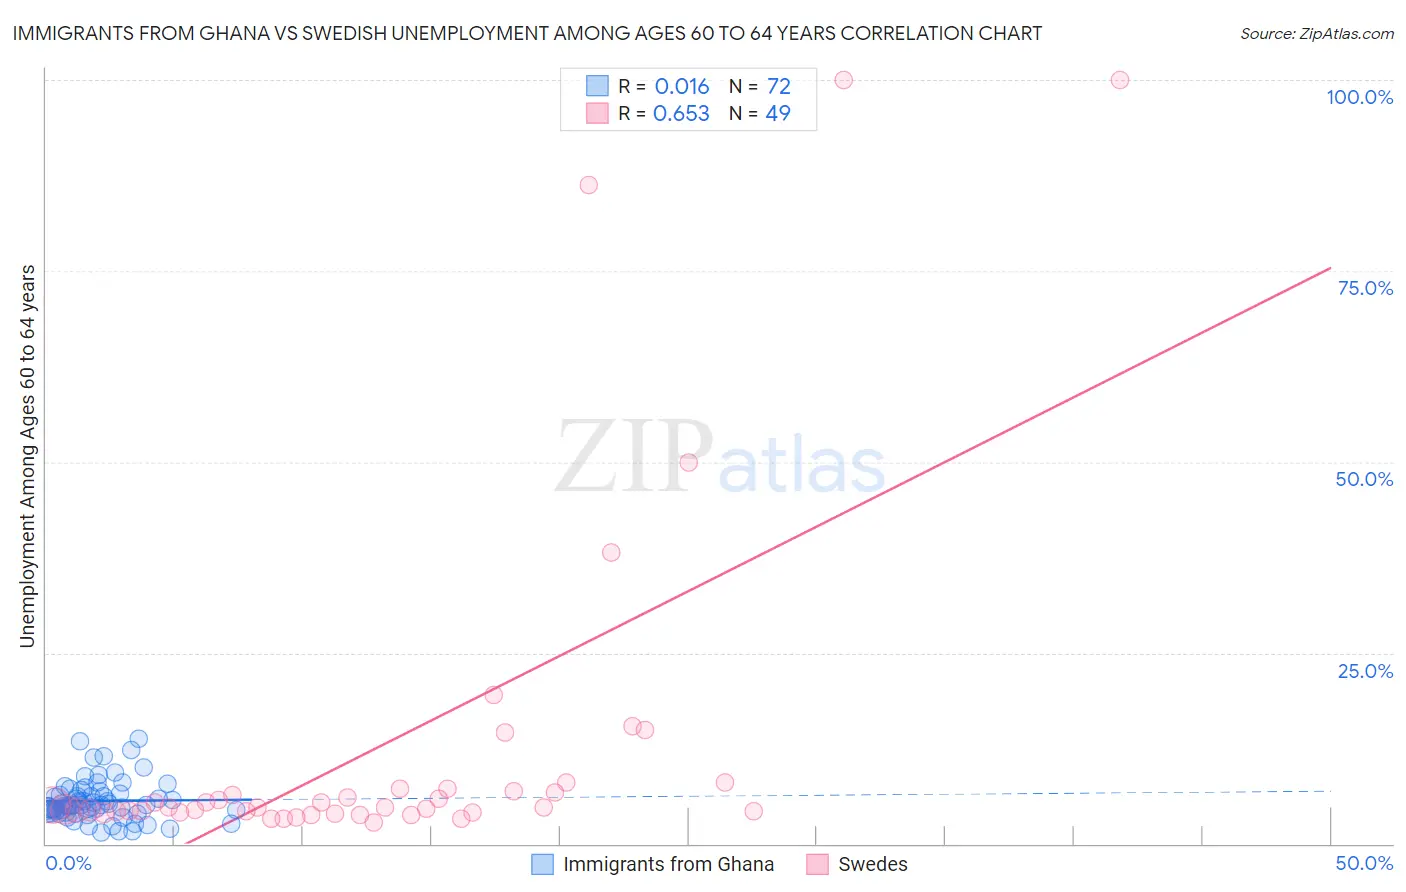
Immigrants from Ghana vs Swedish Unemployment Among Ages 60 to 64 years Correlation Chart
The statistical analysis conducted on geographies consisting of 190,187,925 people shows no correlation between the proportion of Immigrants from Ghana and unemployment rate among population between the ages 60 and 64 in the United States with a correlation coefficient (R) of 0.016 and weighted average of 5.1%. Similarly, the statistical analysis conducted on geographies consisting of 448,314,180 people shows a significant positive correlation between the proportion of Swedes and unemployment rate among population between the ages 60 and 64 in the United States with a correlation coefficient (R) of 0.653 and weighted average of 4.5%, a difference of 12.7%.
Unemployment Among Ages 60 to 64 years Correlation Summary
| Measurement | Immigrants from Ghana | Swedish |
| Minimum | 1.4% | 2.8% |
| Maximum | 13.8% | 100.0% |
| Range | 12.4% | 97.2% |
| Mean | 5.6% | 13.0% |
| Median | 5.0% | 4.8% |
| Interquartile 25% (IQ1) | 4.2% | 4.2% |
| Interquartile 75% (IQ3) | 6.5% | 7.2% |
| Interquartile Range (IQR) | 2.2% | 3.0% |
| Standard Deviation (Sample) | 2.6% | 22.9% |
| Standard Deviation (Population) | 2.6% | 22.7% |
Similar Demographics by Unemployment Among Ages 60 to 64 years
Demographics Similar to Immigrants from Ghana by Unemployment Among Ages 60 to 64 years
In terms of unemployment among ages 60 to 64 years, the demographic groups most similar to Immigrants from Ghana are Immigrants from Uzbekistan (5.1%, a difference of 0.020%), Immigrants (5.1%, a difference of 0.040%), Immigrants from Honduras (5.1%, a difference of 0.090%), Sioux (5.1%, a difference of 0.12%), and Celtic (5.1%, a difference of 0.23%).
| Demographics | Rating | Rank | Unemployment Among Ages 60 to 64 years |
| Costa Ricans | 0.8 /100 | #254 | Tragic 5.1% |
| Estonians | 0.8 /100 | #255 | Tragic 5.1% |
| Immigrants | Peru | 0.7 /100 | #256 | Tragic 5.1% |
| Japanese | 0.6 /100 | #257 | Tragic 5.1% |
| Celtics | 0.5 /100 | #258 | Tragic 5.1% |
| Hondurans | 0.5 /100 | #259 | Tragic 5.1% |
| Immigrants | Honduras | 0.4 /100 | #260 | Tragic 5.1% |
| Immigrants | Ghana | 0.4 /100 | #261 | Tragic 5.1% |
| Immigrants | Uzbekistan | 0.4 /100 | #262 | Tragic 5.1% |
| Immigrants | Immigrants | 0.4 /100 | #263 | Tragic 5.1% |
| Sioux | 0.3 /100 | #264 | Tragic 5.1% |
| Immigrants | Argentina | 0.2 /100 | #265 | Tragic 5.1% |
| Immigrants | Australia | 0.2 /100 | #266 | Tragic 5.1% |
| Immigrants | Bahamas | 0.2 /100 | #267 | Tragic 5.1% |
| Central American Indians | 0.2 /100 | #268 | Tragic 5.1% |
Demographics Similar to Swedes by Unemployment Among Ages 60 to 64 years
In terms of unemployment among ages 60 to 64 years, the demographic groups most similar to Swedes are European (4.5%, a difference of 0.060%), English (4.5%, a difference of 0.17%), Immigrants from Sudan (4.5%, a difference of 0.22%), Liberian (4.5%, a difference of 0.29%), and Scandinavian (4.5%, a difference of 0.35%).
| Demographics | Rating | Rank | Unemployment Among Ages 60 to 64 years |
| Venezuelans | 100.0 /100 | #36 | Exceptional 4.5% |
| Immigrants | Portugal | 100.0 /100 | #37 | Exceptional 4.5% |
| Native Hawaiians | 100.0 /100 | #38 | Exceptional 4.5% |
| Iraqis | 100.0 /100 | #39 | Exceptional 4.5% |
| Scandinavians | 100.0 /100 | #40 | Exceptional 4.5% |
| Immigrants | Sudan | 100.0 /100 | #41 | Exceptional 4.5% |
| English | 100.0 /100 | #42 | Exceptional 4.5% |
| Swedes | 100.0 /100 | #43 | Exceptional 4.5% |
| Europeans | 100.0 /100 | #44 | Exceptional 4.5% |
| Liberians | 99.9 /100 | #45 | Exceptional 4.5% |
| Bhutanese | 99.9 /100 | #46 | Exceptional 4.5% |
| Assyrians/Chaldeans/Syriacs | 99.9 /100 | #47 | Exceptional 4.5% |
| Immigrants | Zimbabwe | 99.9 /100 | #48 | Exceptional 4.6% |
| Scotch-Irish | 99.9 /100 | #49 | Exceptional 4.6% |
| Scottish | 99.9 /100 | #50 | Exceptional 4.6% |