Immigrants from Ghana vs Immigrants from Taiwan Unemployment Among Ages 25 to 29 years
COMPARE
Immigrants from Ghana
Immigrants from Taiwan
Unemployment Among Ages 25 to 29 years
Unemployment Among Ages 25 to 29 years Comparison
Immigrants from Ghana
Immigrants from Taiwan
7.5%
UNEMPLOYMENT AMONG AGES 25 TO 29 YEARS
0.0/ 100
METRIC RATING
275th/ 347
METRIC RANK
6.2%
UNEMPLOYMENT AMONG AGES 25 TO 29 YEARS
98.3/ 100
METRIC RATING
60th/ 347
METRIC RANK
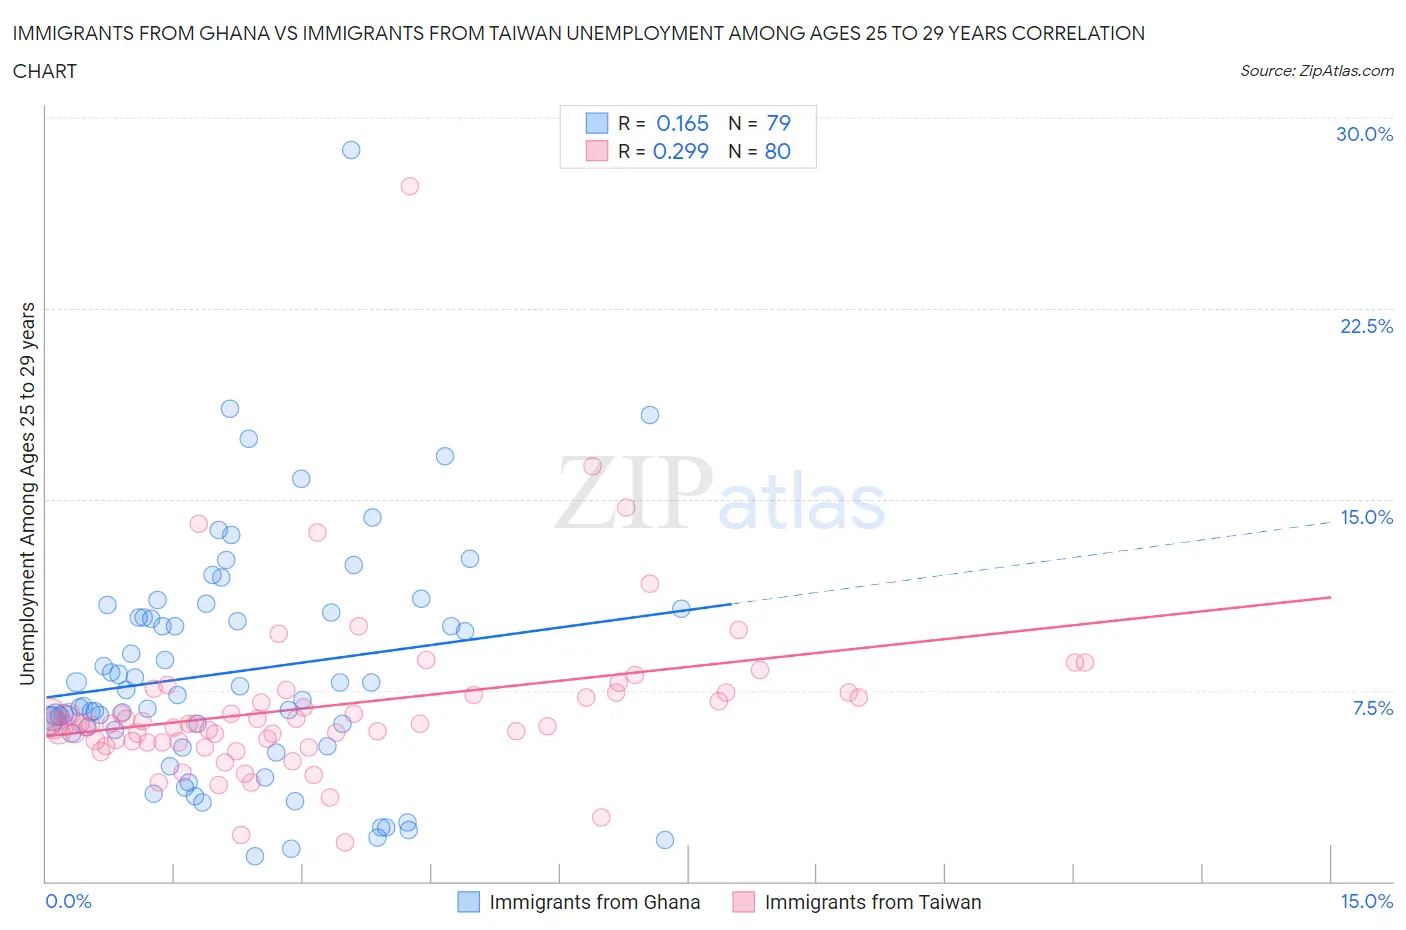
Immigrants from Ghana vs Immigrants from Taiwan Unemployment Among Ages 25 to 29 years Correlation Chart
The statistical analysis conducted on geographies consisting of 195,845,619 people shows a poor positive correlation between the proportion of Immigrants from Ghana and unemployment rate among population between the ages 25 and 29 in the United States with a correlation coefficient (R) of 0.165 and weighted average of 7.5%. Similarly, the statistical analysis conducted on geographies consisting of 288,232,116 people shows a weak positive correlation between the proportion of Immigrants from Taiwan and unemployment rate among population between the ages 25 and 29 in the United States with a correlation coefficient (R) of 0.299 and weighted average of 6.2%, a difference of 20.1%.
Unemployment Among Ages 25 to 29 years Correlation Summary
| Measurement | Immigrants from Ghana | Immigrants from Taiwan |
| Minimum | 0.96% | 1.5% |
| Maximum | 28.7% | 27.3% |
| Range | 27.7% | 25.8% |
| Mean | 8.2% | 6.9% |
| Median | 7.3% | 6.2% |
| Interquartile 25% (IQ1) | 5.8% | 5.5% |
| Interquartile 75% (IQ3) | 10.6% | 7.4% |
| Interquartile Range (IQR) | 4.7% | 1.9% |
| Standard Deviation (Sample) | 4.7% | 3.4% |
| Standard Deviation (Population) | 4.6% | 3.4% |
Similar Demographics by Unemployment Among Ages 25 to 29 years
Demographics Similar to Immigrants from Ghana by Unemployment Among Ages 25 to 29 years
In terms of unemployment among ages 25 to 29 years, the demographic groups most similar to Immigrants from Ghana are Immigrants from Central America (7.5%, a difference of 0.080%), Immigrants from Nigeria (7.5%, a difference of 0.29%), Immigrants from Bahamas (7.5%, a difference of 0.32%), French American Indian (7.5%, a difference of 0.34%), and Choctaw (7.5%, a difference of 0.37%).
| Demographics | Rating | Rank | Unemployment Among Ages 25 to 29 years |
| Immigrants | Ecuador | 0.1 /100 | #268 | Tragic 7.4% |
| Immigrants | Latin America | 0.1 /100 | #269 | Tragic 7.4% |
| Bahamians | 0.0 /100 | #270 | Tragic 7.5% |
| Choctaw | 0.0 /100 | #271 | Tragic 7.5% |
| Immigrants | Bahamas | 0.0 /100 | #272 | Tragic 7.5% |
| Immigrants | Nigeria | 0.0 /100 | #273 | Tragic 7.5% |
| Immigrants | Central America | 0.0 /100 | #274 | Tragic 7.5% |
| Immigrants | Ghana | 0.0 /100 | #275 | Tragic 7.5% |
| French American Indians | 0.0 /100 | #276 | Tragic 7.5% |
| Iroquois | 0.0 /100 | #277 | Tragic 7.5% |
| Mexicans | 0.0 /100 | #278 | Tragic 7.5% |
| Nepalese | 0.0 /100 | #279 | Tragic 7.5% |
| Immigrants | Caribbean | 0.0 /100 | #280 | Tragic 7.5% |
| Immigrants | Bangladesh | 0.0 /100 | #281 | Tragic 7.5% |
| Immigrants | Senegal | 0.0 /100 | #282 | Tragic 7.6% |
Demographics Similar to Immigrants from Taiwan by Unemployment Among Ages 25 to 29 years
In terms of unemployment among ages 25 to 29 years, the demographic groups most similar to Immigrants from Taiwan are Luxembourger (6.2%, a difference of 0.020%), Bhutanese (6.2%, a difference of 0.12%), Immigrants from Eastern Asia (6.2%, a difference of 0.15%), Immigrants from China (6.2%, a difference of 0.22%), and Kenyan (6.3%, a difference of 0.29%).
| Demographics | Rating | Rank | Unemployment Among Ages 25 to 29 years |
| Turks | 98.8 /100 | #53 | Exceptional 6.2% |
| Swedes | 98.8 /100 | #54 | Exceptional 6.2% |
| Immigrants | Netherlands | 98.7 /100 | #55 | Exceptional 6.2% |
| Immigrants | Burma/Myanmar | 98.7 /100 | #56 | Exceptional 6.2% |
| Immigrants | Saudi Arabia | 98.6 /100 | #57 | Exceptional 6.2% |
| Immigrants | Eastern Asia | 98.4 /100 | #58 | Exceptional 6.2% |
| Luxembourgers | 98.3 /100 | #59 | Exceptional 6.2% |
| Immigrants | Taiwan | 98.3 /100 | #60 | Exceptional 6.2% |
| Bhutanese | 98.2 /100 | #61 | Exceptional 6.2% |
| Immigrants | China | 98.1 /100 | #62 | Exceptional 6.2% |
| Kenyans | 98.0 /100 | #63 | Exceptional 6.3% |
| Immigrants | Sri Lanka | 97.9 /100 | #64 | Exceptional 6.3% |
| Immigrants | Lebanon | 97.8 /100 | #65 | Exceptional 6.3% |
| Indians (Asian) | 97.8 /100 | #66 | Exceptional 6.3% |
| Immigrants | Northern Africa | 97.8 /100 | #67 | Exceptional 6.3% |