Immigrants from Ghana vs Immigrants from Romania Unemployment Among Ages 65 to 74 years
COMPARE
Immigrants from Ghana
Immigrants from Romania
Unemployment Among Ages 65 to 74 years
Unemployment Among Ages 65 to 74 years Comparison
Immigrants from Ghana
Immigrants from Romania
5.6%
UNEMPLOYMENT AMONG AGES 65 TO 74 YEARS
1.4/ 100
METRIC RATING
242nd/ 347
METRIC RANK
5.3%
UNEMPLOYMENT AMONG AGES 65 TO 74 YEARS
73.5/ 100
METRIC RATING
149th/ 347
METRIC RANK
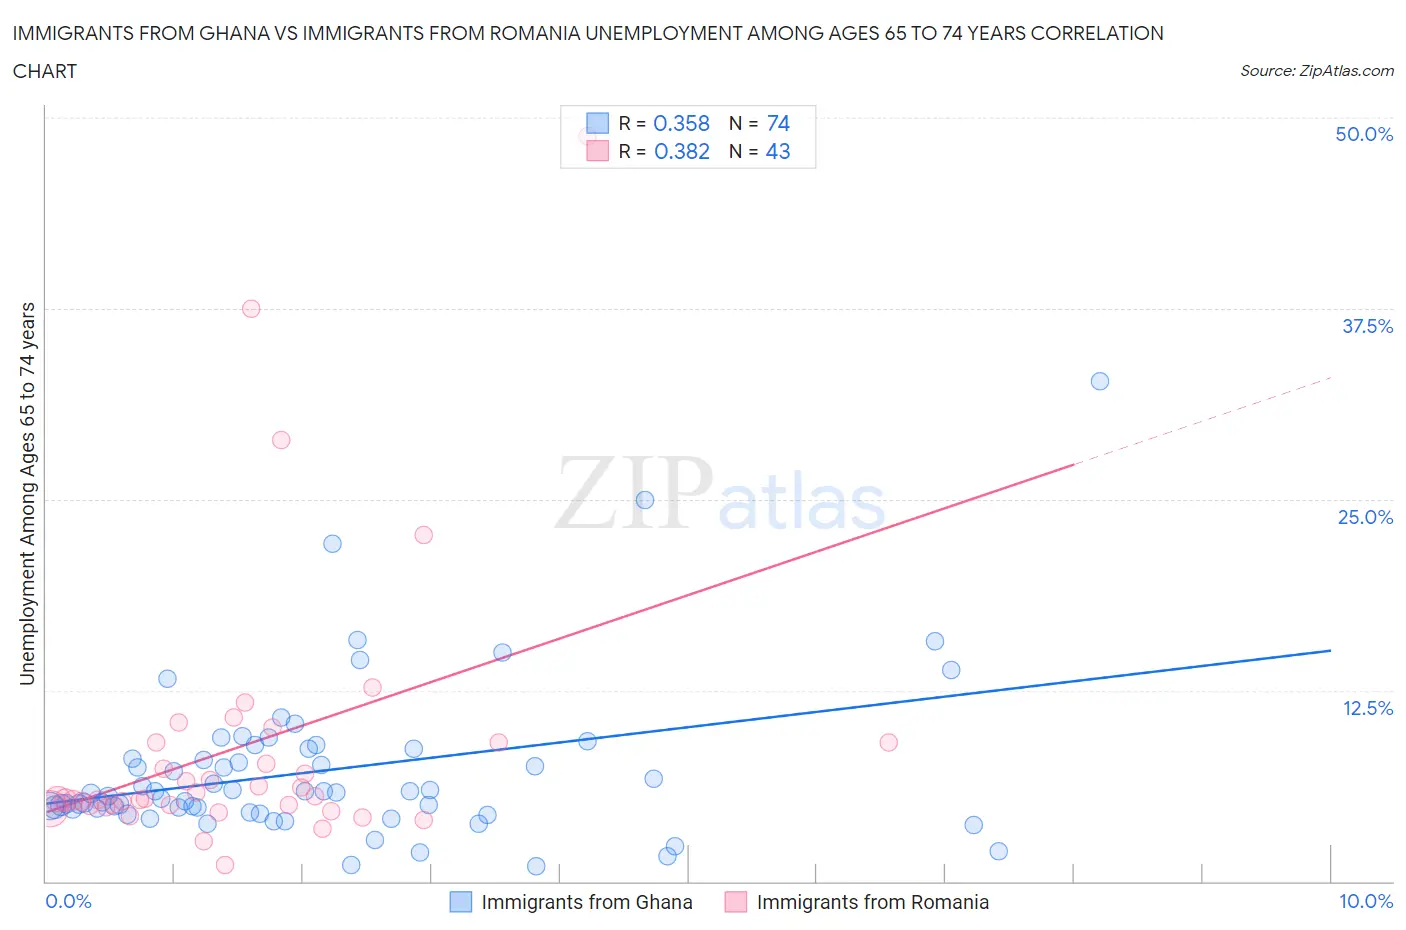
Immigrants from Ghana vs Immigrants from Romania Unemployment Among Ages 65 to 74 years Correlation Chart
The statistical analysis conducted on geographies consisting of 186,857,446 people shows a mild positive correlation between the proportion of Immigrants from Ghana and unemployment rate among population between the ages 65 and 74 in the United States with a correlation coefficient (R) of 0.358 and weighted average of 5.6%. Similarly, the statistical analysis conducted on geographies consisting of 239,287,253 people shows a mild positive correlation between the proportion of Immigrants from Romania and unemployment rate among population between the ages 65 and 74 in the United States with a correlation coefficient (R) of 0.382 and weighted average of 5.3%, a difference of 4.4%.
Unemployment Among Ages 65 to 74 years Correlation Summary
| Measurement | Immigrants from Ghana | Immigrants from Romania |
| Minimum | 1.0% | 1.1% |
| Maximum | 32.7% | 48.8% |
| Range | 31.7% | 47.7% |
| Mean | 7.3% | 8.8% |
| Median | 5.8% | 5.4% |
| Interquartile 25% (IQ1) | 4.7% | 4.9% |
| Interquartile 75% (IQ3) | 8.6% | 9.1% |
| Interquartile Range (IQR) | 3.9% | 4.2% |
| Standard Deviation (Sample) | 5.2% | 9.2% |
| Standard Deviation (Population) | 5.2% | 9.0% |
Similar Demographics by Unemployment Among Ages 65 to 74 years
Demographics Similar to Immigrants from Ghana by Unemployment Among Ages 65 to 74 years
In terms of unemployment among ages 65 to 74 years, the demographic groups most similar to Immigrants from Ghana are Cree (5.6%, a difference of 0.0%), Ghanaian (5.6%, a difference of 0.040%), Immigrants from Peru (5.6%, a difference of 0.060%), German Russian (5.5%, a difference of 0.13%), and Cajun (5.5%, a difference of 0.21%).
| Demographics | Rating | Rank | Unemployment Among Ages 65 to 74 years |
| Peruvians | 2.2 /100 | #235 | Tragic 5.5% |
| Hopi | 2.2 /100 | #236 | Tragic 5.5% |
| Immigrants | Belize | 2.2 /100 | #237 | Tragic 5.5% |
| Cajuns | 1.8 /100 | #238 | Tragic 5.5% |
| German Russians | 1.6 /100 | #239 | Tragic 5.5% |
| Ghanaians | 1.4 /100 | #240 | Tragic 5.6% |
| Cree | 1.4 /100 | #241 | Tragic 5.6% |
| Immigrants | Ghana | 1.4 /100 | #242 | Tragic 5.6% |
| Immigrants | Peru | 1.3 /100 | #243 | Tragic 5.6% |
| Immigrants | Micronesia | 0.9 /100 | #244 | Tragic 5.6% |
| Immigrants | Greece | 0.9 /100 | #245 | Tragic 5.6% |
| Paraguayans | 0.9 /100 | #246 | Tragic 5.6% |
| Immigrants | Immigrants | 0.9 /100 | #247 | Tragic 5.6% |
| Immigrants | Argentina | 0.9 /100 | #248 | Tragic 5.6% |
| Trinidadians and Tobagonians | 0.8 /100 | #249 | Tragic 5.6% |
Demographics Similar to Immigrants from Romania by Unemployment Among Ages 65 to 74 years
In terms of unemployment among ages 65 to 74 years, the demographic groups most similar to Immigrants from Romania are Immigrants from Sri Lanka (5.3%, a difference of 0.010%), Immigrants from Poland (5.3%, a difference of 0.010%), Immigrants from Indonesia (5.3%, a difference of 0.020%), Spanish (5.3%, a difference of 0.040%), and Immigrants from Cabo Verde (5.3%, a difference of 0.040%).
| Demographics | Rating | Rank | Unemployment Among Ages 65 to 74 years |
| Turks | 76.2 /100 | #142 | Good 5.3% |
| New Zealanders | 76.1 /100 | #143 | Good 5.3% |
| Immigrants | Chile | 76.0 /100 | #144 | Good 5.3% |
| Canadians | 75.0 /100 | #145 | Good 5.3% |
| Irish | 74.8 /100 | #146 | Good 5.3% |
| Immigrants | Latvia | 74.6 /100 | #147 | Good 5.3% |
| Immigrants | Sri Lanka | 73.8 /100 | #148 | Good 5.3% |
| Immigrants | Romania | 73.5 /100 | #149 | Good 5.3% |
| Immigrants | Poland | 73.2 /100 | #150 | Good 5.3% |
| Immigrants | Indonesia | 72.9 /100 | #151 | Good 5.3% |
| Spanish | 72.6 /100 | #152 | Good 5.3% |
| Immigrants | Cabo Verde | 72.5 /100 | #153 | Good 5.3% |
| Poles | 72.4 /100 | #154 | Good 5.3% |
| Immigrants | Cameroon | 72.1 /100 | #155 | Good 5.3% |
| Dutch | 72.0 /100 | #156 | Good 5.3% |