Immigrants from Ghana vs Immigrants from North Macedonia Unemployment Among Seniors over 75 years
COMPARE
Immigrants from Ghana
Immigrants from North Macedonia
Unemployment Among Seniors over 75 years
Unemployment Among Seniors over 75 years Comparison
Immigrants from Ghana
Immigrants from North Macedonia
9.2%
UNEMPLOYMENT AMONG SENIORS OVER 75 YEARS
1.7/ 100
METRIC RATING
254th/ 347
METRIC RANK
11.3%
UNEMPLOYMENT AMONG SENIORS OVER 75 YEARS
0.0/ 100
METRIC RATING
336th/ 347
METRIC RANK
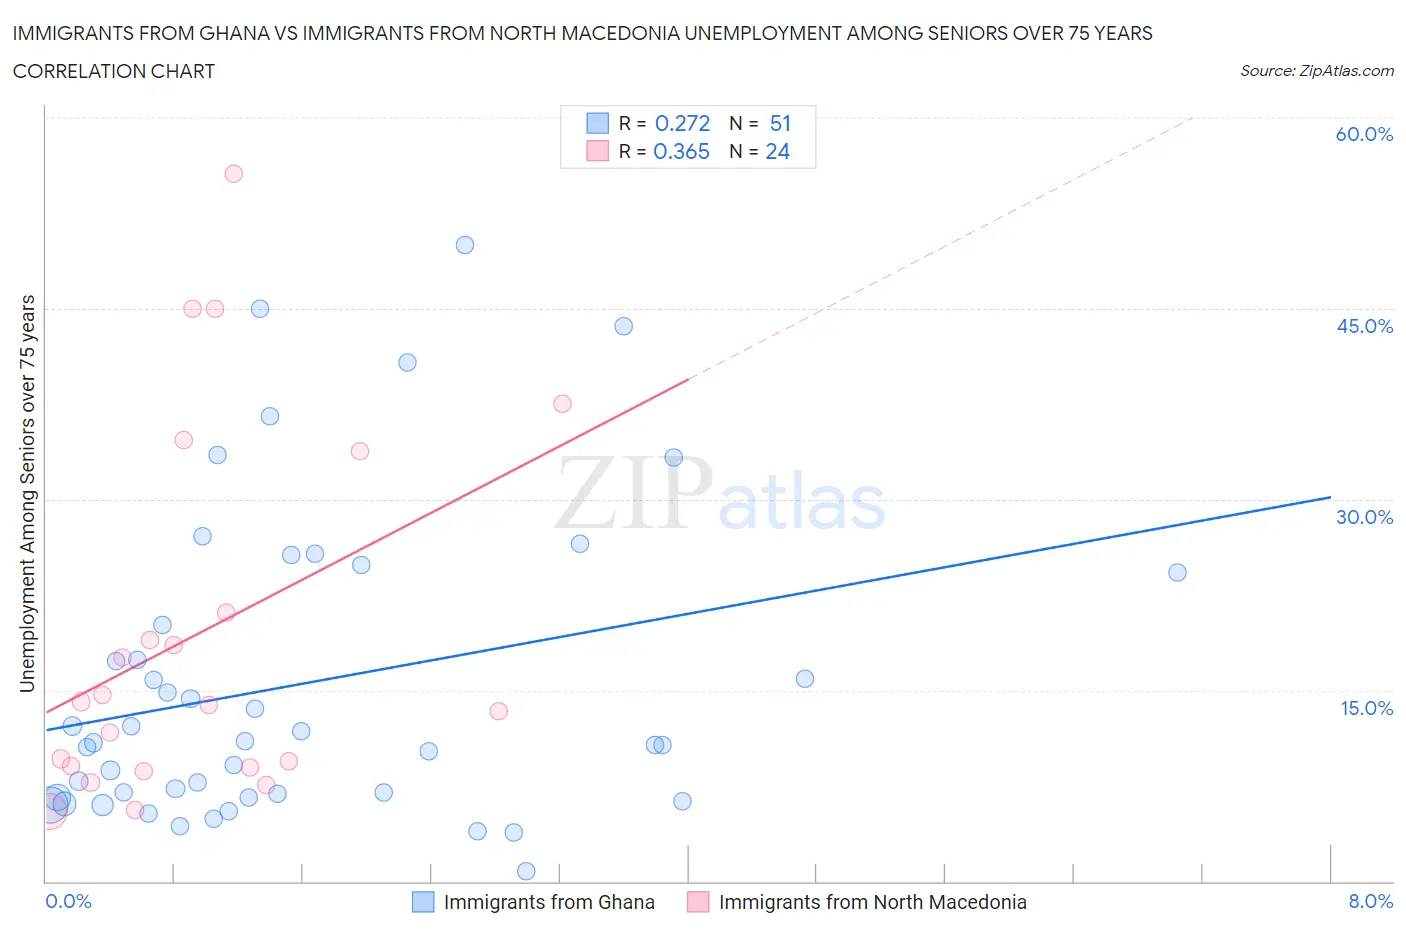
Immigrants from Ghana vs Immigrants from North Macedonia Unemployment Among Seniors over 75 years Correlation Chart
The statistical analysis conducted on geographies consisting of 125,164,435 people shows a weak positive correlation between the proportion of Immigrants from Ghana and unemployment rate among seniors over the age of 75 in the United States with a correlation coefficient (R) of 0.272 and weighted average of 9.2%. Similarly, the statistical analysis conducted on geographies consisting of 57,197,573 people shows a mild positive correlation between the proportion of Immigrants from North Macedonia and unemployment rate among seniors over the age of 75 in the United States with a correlation coefficient (R) of 0.365 and weighted average of 11.3%, a difference of 22.6%.
Unemployment Among Seniors over 75 years Correlation Summary
| Measurement | Immigrants from Ghana | Immigrants from North Macedonia |
| Minimum | 0.80% | 5.5% |
| Maximum | 50.0% | 55.6% |
| Range | 49.2% | 50.1% |
| Mean | 15.6% | 19.5% |
| Median | 10.9% | 13.9% |
| Interquartile 25% (IQ1) | 6.6% | 9.0% |
| Interquartile 75% (IQ3) | 24.3% | 27.4% |
| Interquartile Range (IQR) | 17.7% | 18.4% |
| Standard Deviation (Sample) | 12.1% | 14.4% |
| Standard Deviation (Population) | 12.0% | 14.1% |
Similar Demographics by Unemployment Among Seniors over 75 years
Demographics Similar to Immigrants from Ghana by Unemployment Among Seniors over 75 years
In terms of unemployment among seniors over 75 years, the demographic groups most similar to Immigrants from Ghana are Pima (9.2%, a difference of 0.090%), Immigrants from Scotland (9.2%, a difference of 0.19%), Immigrants from Sudan (9.2%, a difference of 0.22%), Immigrants from Poland (9.2%, a difference of 0.25%), and Brazilian (9.3%, a difference of 0.34%).
| Demographics | Rating | Rank | Unemployment Among Seniors over 75 years |
| Sub-Saharan Africans | 2.3 /100 | #247 | Tragic 9.2% |
| Blackfeet | 2.3 /100 | #248 | Tragic 9.2% |
| Immigrants | Saudi Arabia | 2.2 /100 | #249 | Tragic 9.2% |
| Central American Indians | 2.2 /100 | #250 | Tragic 9.2% |
| Immigrants | Poland | 2.0 /100 | #251 | Tragic 9.2% |
| Immigrants | Sudan | 2.0 /100 | #252 | Tragic 9.2% |
| Pima | 1.8 /100 | #253 | Tragic 9.2% |
| Immigrants | Ghana | 1.7 /100 | #254 | Tragic 9.2% |
| Immigrants | Scotland | 1.4 /100 | #255 | Tragic 9.2% |
| Brazilians | 1.3 /100 | #256 | Tragic 9.3% |
| Hawaiians | 1.2 /100 | #257 | Tragic 9.3% |
| Immigrants | England | 1.0 /100 | #258 | Tragic 9.3% |
| Slovenes | 1.0 /100 | #259 | Tragic 9.3% |
| Immigrants | Cameroon | 1.0 /100 | #260 | Tragic 9.3% |
| Celtics | 0.8 /100 | #261 | Tragic 9.3% |
Demographics Similar to Immigrants from North Macedonia by Unemployment Among Seniors over 75 years
In terms of unemployment among seniors over 75 years, the demographic groups most similar to Immigrants from North Macedonia are Cape Verdean (11.4%, a difference of 0.89%), French Canadian (11.2%, a difference of 1.2%), Assyrian/Chaldean/Syriac (11.1%, a difference of 2.3%), Alaskan Athabascan (11.0%, a difference of 2.7%), and Immigrants from Liberia (10.9%, a difference of 3.9%).
| Demographics | Rating | Rank | Unemployment Among Seniors over 75 years |
| Tsimshian | 0.0 /100 | #329 | Tragic 10.5% |
| Immigrants | Azores | 0.0 /100 | #330 | Tragic 10.7% |
| Tohono O'odham | 0.0 /100 | #331 | Tragic 10.8% |
| Immigrants | Liberia | 0.0 /100 | #332 | Tragic 10.9% |
| Alaskan Athabascans | 0.0 /100 | #333 | Tragic 11.0% |
| Assyrians/Chaldeans/Syriacs | 0.0 /100 | #334 | Tragic 11.1% |
| French Canadians | 0.0 /100 | #335 | Tragic 11.2% |
| Immigrants | North Macedonia | 0.0 /100 | #336 | Tragic 11.3% |
| Cape Verdeans | 0.0 /100 | #337 | Tragic 11.4% |
| Immigrants | Cabo Verde | 0.0 /100 | #338 | Tragic 12.3% |
| Cajuns | 0.0 /100 | #339 | Tragic 12.5% |
| Yup'ik | 0.0 /100 | #340 | Tragic 12.8% |
| Lumbee | 0.0 /100 | #341 | Tragic 13.5% |
| Hmong | 0.0 /100 | #342 | Tragic 13.7% |
| Alaska Natives | 0.0 /100 | #343 | Tragic 14.7% |