Immigrants from Ghana vs Immigrants from Congo Unemployment Among Ages 45 to 54 years
COMPARE
Immigrants from Ghana
Immigrants from Congo
Unemployment Among Ages 45 to 54 years
Unemployment Among Ages 45 to 54 years Comparison
Immigrants from Ghana
Immigrants from Congo
5.0%
UNEMPLOYMENT AMONG AGES 45 TO 54 YEARS
0.0/ 100
METRIC RATING
270th/ 347
METRIC RANK
4.4%
UNEMPLOYMENT AMONG AGES 45 TO 54 YEARS
81.8/ 100
METRIC RATING
138th/ 347
METRIC RANK
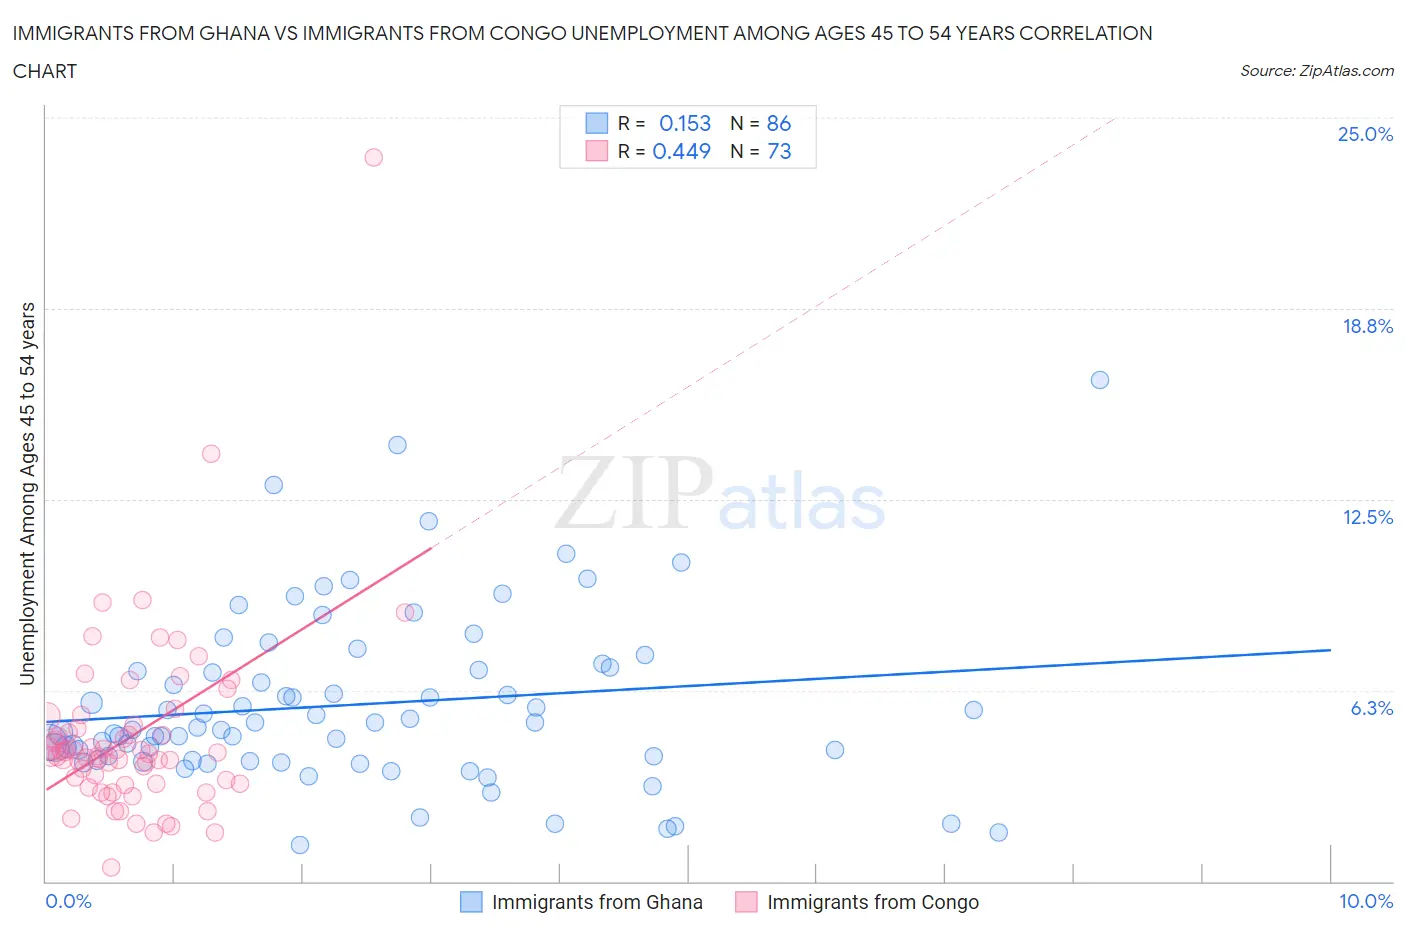
Immigrants from Ghana vs Immigrants from Congo Unemployment Among Ages 45 to 54 years Correlation Chart
The statistical analysis conducted on geographies consisting of 197,626,687 people shows a poor positive correlation between the proportion of Immigrants from Ghana and unemployment rate among population between the ages 45 and 54 in the United States with a correlation coefficient (R) of 0.153 and weighted average of 5.0%. Similarly, the statistical analysis conducted on geographies consisting of 91,534,278 people shows a moderate positive correlation between the proportion of Immigrants from Congo and unemployment rate among population between the ages 45 and 54 in the United States with a correlation coefficient (R) of 0.449 and weighted average of 4.4%, a difference of 11.7%.
Unemployment Among Ages 45 to 54 years Correlation Summary
| Measurement | Immigrants from Ghana | Immigrants from Congo |
| Minimum | 1.2% | 0.45% |
| Maximum | 16.4% | 23.7% |
| Range | 15.2% | 23.3% |
| Mean | 5.8% | 4.7% |
| Median | 5.0% | 4.2% |
| Interquartile 25% (IQ1) | 4.0% | 3.2% |
| Interquartile 75% (IQ3) | 6.9% | 5.1% |
| Interquartile Range (IQR) | 2.9% | 1.9% |
| Standard Deviation (Sample) | 2.8% | 3.1% |
| Standard Deviation (Population) | 2.8% | 3.1% |
Similar Demographics by Unemployment Among Ages 45 to 54 years
Demographics Similar to Immigrants from Ghana by Unemployment Among Ages 45 to 54 years
In terms of unemployment among ages 45 to 54 years, the demographic groups most similar to Immigrants from Ghana are Cajun (5.0%, a difference of 0.070%), Somali (5.0%, a difference of 0.14%), Immigrants from Central America (5.0%, a difference of 0.25%), Immigrants from Latin America (5.0%, a difference of 0.41%), and U.S. Virgin Islander (5.0%, a difference of 0.46%).
| Demographics | Rating | Rank | Unemployment Among Ages 45 to 54 years |
| Immigrants | Fiji | 0.1 /100 | #263 | Tragic 4.9% |
| Immigrants | Guatemala | 0.1 /100 | #264 | Tragic 4.9% |
| Immigrants | Somalia | 0.1 /100 | #265 | Tragic 4.9% |
| Ghanaians | 0.0 /100 | #266 | Tragic 4.9% |
| Bahamians | 0.0 /100 | #267 | Tragic 4.9% |
| Immigrants | Uzbekistan | 0.0 /100 | #268 | Tragic 4.9% |
| Somalis | 0.0 /100 | #269 | Tragic 5.0% |
| Immigrants | Ghana | 0.0 /100 | #270 | Tragic 5.0% |
| Cajuns | 0.0 /100 | #271 | Tragic 5.0% |
| Immigrants | Central America | 0.0 /100 | #272 | Tragic 5.0% |
| Immigrants | Latin America | 0.0 /100 | #273 | Tragic 5.0% |
| U.S. Virgin Islanders | 0.0 /100 | #274 | Tragic 5.0% |
| Bermudans | 0.0 /100 | #275 | Tragic 5.0% |
| French American Indians | 0.0 /100 | #276 | Tragic 5.0% |
| Immigrants | Mexico | 0.0 /100 | #277 | Tragic 5.0% |
Demographics Similar to Immigrants from Congo by Unemployment Among Ages 45 to 54 years
In terms of unemployment among ages 45 to 54 years, the demographic groups most similar to Immigrants from Congo are Lebanese (4.4%, a difference of 0.010%), Immigrants from Kuwait (4.4%, a difference of 0.010%), Immigrants from Zaire (4.4%, a difference of 0.090%), Immigrants from Middle Africa (4.4%, a difference of 0.13%), and Immigrants from Afghanistan (4.4%, a difference of 0.16%).
| Demographics | Rating | Rank | Unemployment Among Ages 45 to 54 years |
| Immigrants | Germany | 85.9 /100 | #131 | Excellent 4.4% |
| Immigrants | Eastern Africa | 85.1 /100 | #132 | Excellent 4.4% |
| Immigrants | Cameroon | 84.8 /100 | #133 | Excellent 4.4% |
| Afghans | 84.6 /100 | #134 | Excellent 4.4% |
| Immigrants | Eastern Asia | 84.0 /100 | #135 | Excellent 4.4% |
| Immigrants | Middle Africa | 83.3 /100 | #136 | Excellent 4.4% |
| Lebanese | 81.9 /100 | #137 | Excellent 4.4% |
| Immigrants | Congo | 81.8 /100 | #138 | Excellent 4.4% |
| Immigrants | Kuwait | 81.7 /100 | #139 | Excellent 4.4% |
| Immigrants | Zaire | 80.7 /100 | #140 | Excellent 4.4% |
| Immigrants | Afghanistan | 79.6 /100 | #141 | Good 4.4% |
| Immigrants | Netherlands | 79.4 /100 | #142 | Good 4.4% |
| Macedonians | 79.0 /100 | #143 | Good 4.5% |
| Taiwanese | 77.9 /100 | #144 | Good 4.5% |
| Immigrants | Latvia | 77.5 /100 | #145 | Good 4.5% |