Immigrants from Germany vs Indonesian Unemployment
COMPARE
Immigrants from Germany
Indonesian
Unemployment
Unemployment Comparison
Immigrants from Germany
Indonesians
5.1%
UNEMPLOYMENT
90.8/ 100
METRIC RATING
118th/ 347
METRIC RANK
5.1%
UNEMPLOYMENT
82.3/ 100
METRIC RATING
144th/ 347
METRIC RANK
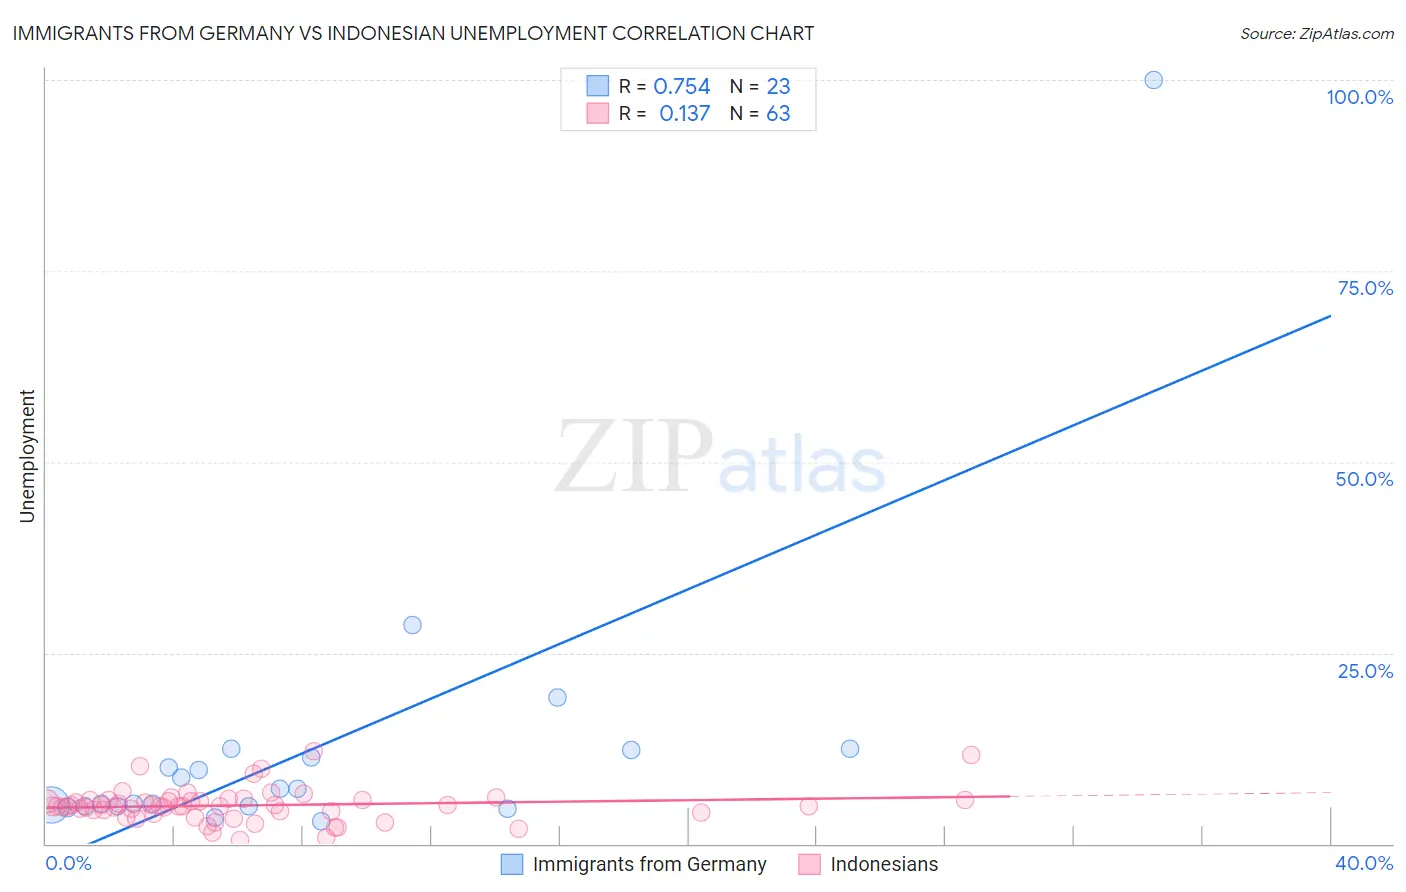
Immigrants from Germany vs Indonesian Unemployment Correlation Chart
The statistical analysis conducted on geographies consisting of 463,047,668 people shows a strong positive correlation between the proportion of Immigrants from Germany and unemployment in the United States with a correlation coefficient (R) of 0.754 and weighted average of 5.1%. Similarly, the statistical analysis conducted on geographies consisting of 162,697,031 people shows a poor positive correlation between the proportion of Indonesians and unemployment in the United States with a correlation coefficient (R) of 0.137 and weighted average of 5.1%, a difference of 1.2%.
Unemployment Correlation Summary
| Measurement | Immigrants from Germany | Indonesian |
| Minimum | 2.9% | 0.50% |
| Maximum | 100.0% | 12.1% |
| Range | 97.1% | 11.6% |
| Mean | 12.6% | 5.0% |
| Median | 7.2% | 5.0% |
| Interquartile 25% (IQ1) | 4.9% | 4.1% |
| Interquartile 75% (IQ3) | 12.2% | 5.7% |
| Interquartile Range (IQR) | 7.3% | 1.6% |
| Standard Deviation (Sample) | 19.9% | 2.2% |
| Standard Deviation (Population) | 19.5% | 2.2% |
Similar Demographics by Unemployment
Demographics Similar to Immigrants from Germany by Unemployment
In terms of unemployment, the demographic groups most similar to Immigrants from Germany are Immigrants from Malaysia (5.1%, a difference of 0.040%), Immigrants from Sri Lanka (5.1%, a difference of 0.050%), Immigrants from Western Europe (5.1%, a difference of 0.070%), Immigrants from France (5.1%, a difference of 0.20%), and Macedonian (5.1%, a difference of 0.21%).
| Demographics | Rating | Rank | Unemployment |
| Chileans | 93.2 /100 | #111 | Exceptional 5.0% |
| South Africans | 92.6 /100 | #112 | Exceptional 5.1% |
| Argentineans | 92.4 /100 | #113 | Exceptional 5.1% |
| Immigrants | Ireland | 92.1 /100 | #114 | Exceptional 5.1% |
| Immigrants | Western Europe | 91.1 /100 | #115 | Exceptional 5.1% |
| Immigrants | Sri Lanka | 91.1 /100 | #116 | Exceptional 5.1% |
| Immigrants | Malaysia | 91.0 /100 | #117 | Exceptional 5.1% |
| Immigrants | Germany | 90.8 /100 | #118 | Exceptional 5.1% |
| Immigrants | France | 89.7 /100 | #119 | Excellent 5.1% |
| Macedonians | 89.7 /100 | #120 | Excellent 5.1% |
| Lebanese | 89.2 /100 | #121 | Excellent 5.1% |
| Immigrants | Switzerland | 89.1 /100 | #122 | Excellent 5.1% |
| Asians | 89.0 /100 | #123 | Excellent 5.1% |
| Ethiopians | 88.6 /100 | #124 | Excellent 5.1% |
| Immigrants | Eastern Asia | 88.3 /100 | #125 | Excellent 5.1% |
Demographics Similar to Indonesians by Unemployment
In terms of unemployment, the demographic groups most similar to Indonesians are Immigrants from Chile (5.1%, a difference of 0.050%), Immigrants from Norway (5.1%, a difference of 0.050%), Immigrants from Asia (5.1%, a difference of 0.060%), Indian (Asian) (5.1%, a difference of 0.070%), and Immigrants from Pakistan (5.1%, a difference of 0.10%).
| Demographics | Rating | Rank | Unemployment |
| Immigrants | Saudi Arabia | 85.6 /100 | #137 | Excellent 5.1% |
| Immigrants | Hungary | 85.6 /100 | #138 | Excellent 5.1% |
| Pakistanis | 85.3 /100 | #139 | Excellent 5.1% |
| Immigrants | Denmark | 84.3 /100 | #140 | Excellent 5.1% |
| Palestinians | 83.4 /100 | #141 | Excellent 5.1% |
| Immigrants | Pakistan | 83.2 /100 | #142 | Excellent 5.1% |
| Immigrants | Chile | 82.8 /100 | #143 | Excellent 5.1% |
| Indonesians | 82.3 /100 | #144 | Excellent 5.1% |
| Immigrants | Norway | 81.8 /100 | #145 | Excellent 5.1% |
| Immigrants | Asia | 81.8 /100 | #146 | Excellent 5.1% |
| Indians (Asian) | 81.6 /100 | #147 | Excellent 5.1% |
| Immigrants | Italy | 79.1 /100 | #148 | Good 5.1% |
| Syrians | 77.7 /100 | #149 | Good 5.2% |
| Potawatomi | 76.2 /100 | #150 | Good 5.2% |
| Immigrants | Eastern Europe | 75.3 /100 | #151 | Good 5.2% |