Immigrants from Germany vs Celtic Unemployment Among Seniors over 75 years
COMPARE
Immigrants from Germany
Celtic
Unemployment Among Seniors over 75 years
Unemployment Among Seniors over 75 years Comparison
Immigrants from Germany
Celtics
9.2%
UNEMPLOYMENT AMONG SENIORS OVER 75 YEARS
2.7/ 100
METRIC RATING
244th/ 347
METRIC RANK
9.3%
UNEMPLOYMENT AMONG SENIORS OVER 75 YEARS
0.8/ 100
METRIC RATING
261st/ 347
METRIC RANK
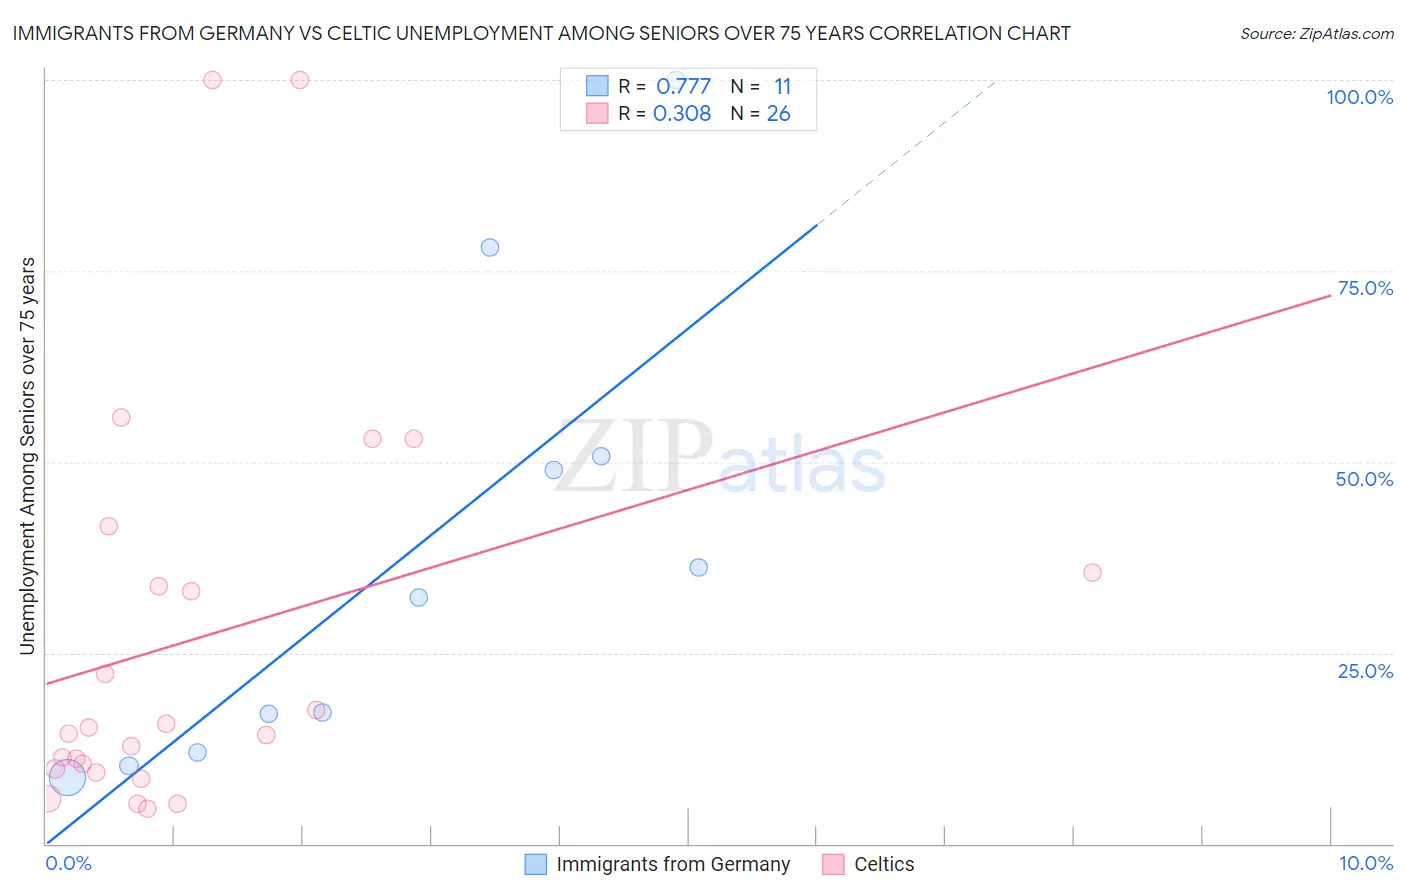
Immigrants from Germany vs Celtic Unemployment Among Seniors over 75 years Correlation Chart
The statistical analysis conducted on geographies consisting of 218,928,696 people shows a strong positive correlation between the proportion of Immigrants from Germany and unemployment rate among seniors over the age of 75 in the United States with a correlation coefficient (R) of 0.777 and weighted average of 9.2%. Similarly, the statistical analysis conducted on geographies consisting of 110,310,169 people shows a mild positive correlation between the proportion of Celtics and unemployment rate among seniors over the age of 75 in the United States with a correlation coefficient (R) of 0.308 and weighted average of 9.3%, a difference of 1.6%.
Unemployment Among Seniors over 75 years Correlation Summary
| Measurement | Immigrants from Germany | Celtic |
| Minimum | 8.7% | 4.6% |
| Maximum | 100.0% | 100.0% |
| Range | 91.3% | 95.4% |
| Mean | 37.4% | 26.9% |
| Median | 32.3% | 14.8% |
| Interquartile 25% (IQ1) | 12.0% | 9.8% |
| Interquartile 75% (IQ3) | 50.7% | 35.5% |
| Interquartile Range (IQR) | 38.7% | 25.7% |
| Standard Deviation (Sample) | 29.9% | 26.6% |
| Standard Deviation (Population) | 28.5% | 26.1% |
Demographics Similar to Immigrants from Germany and Celtics by Unemployment Among Seniors over 75 years
In terms of unemployment among seniors over 75 years, the demographic groups most similar to Immigrants from Germany are Sierra Leonean (9.2%, a difference of 0.030%), Slavic (9.2%, a difference of 0.030%), Immigrants from Canada (9.2%, a difference of 0.060%), Immigrants from North America (9.2%, a difference of 0.18%), and Subsaharan African (9.2%, a difference of 0.20%). Similarly, the demographic groups most similar to Celtics are Austrian (9.3%, a difference of 0.10%), Immigrants from Cameroon (9.3%, a difference of 0.26%), Slovene (9.3%, a difference of 0.31%), Immigrants from England (9.3%, a difference of 0.33%), and Hawaiian (9.3%, a difference of 0.47%).
| Demographics | Rating | Rank | Unemployment Among Seniors over 75 years |
| Sierra Leoneans | 2.8 /100 | #242 | Tragic 9.2% |
| Slavs | 2.8 /100 | #243 | Tragic 9.2% |
| Immigrants | Germany | 2.7 /100 | #244 | Tragic 9.2% |
| Immigrants | Canada | 2.6 /100 | #245 | Tragic 9.2% |
| Immigrants | North America | 2.4 /100 | #246 | Tragic 9.2% |
| Sub-Saharan Africans | 2.3 /100 | #247 | Tragic 9.2% |
| Blackfeet | 2.3 /100 | #248 | Tragic 9.2% |
| Immigrants | Saudi Arabia | 2.2 /100 | #249 | Tragic 9.2% |
| Central American Indians | 2.2 /100 | #250 | Tragic 9.2% |
| Immigrants | Poland | 2.0 /100 | #251 | Tragic 9.2% |
| Immigrants | Sudan | 2.0 /100 | #252 | Tragic 9.2% |
| Pima | 1.8 /100 | #253 | Tragic 9.2% |
| Immigrants | Ghana | 1.7 /100 | #254 | Tragic 9.2% |
| Immigrants | Scotland | 1.4 /100 | #255 | Tragic 9.2% |
| Brazilians | 1.3 /100 | #256 | Tragic 9.3% |
| Hawaiians | 1.2 /100 | #257 | Tragic 9.3% |
| Immigrants | England | 1.0 /100 | #258 | Tragic 9.3% |
| Slovenes | 1.0 /100 | #259 | Tragic 9.3% |
| Immigrants | Cameroon | 1.0 /100 | #260 | Tragic 9.3% |
| Celtics | 0.8 /100 | #261 | Tragic 9.3% |
| Austrians | 0.7 /100 | #262 | Tragic 9.3% |